Allstate 2012 Annual Report Download - page 207
Download and view the complete annual report
Please find page 207 of the 2012 Allstate annual report below. You can navigate through the pages in the report by either clicking on the pages listed below, or by using the keyword search tool below to find specific information within the annual report.-
 1
1 -
2
-
3
-
4
-
5
-
6
-
7
-
8
-
9
-
10
-
11
-
12
-
13
-
14
-
15
-
16
-
17
-
18
-
19
-
20
-
21
-
22
-
23
-
24
-
25
-
26
-
27
-
28
-
29
-
30
-
31
-
32
-
33
-
34
-
35
-
36
-
37
-
38
-
39
-
40
-
41
-
42
-
43
-
44
-
45
-
46
-
47
-
48
-
49
-
50
-
51
-
52
-
53
-
54
-
55
-
56
-
57
-
58
-
59
-
60
-
61
-
62
-
63
-
64
-
65
-
66
-
67
-
68
-
69
-
70
-
71
-
72
-
73
-
74
-
75
-
76
-
77
-
78
-
79
-
80
-
81
-
82
-
83
-
84
-
85
-
86
-
87
-
88
-
89
-
90
-
91
-
92
-
93
-
94
-
95
-
96
-
97
-
98
-
99
-
100
-
101
-
102
-
103
-
104
-
105
-
106
-
107
-
108
-
109
-
110
-
111
-
112
-
113
-
114
-
115
-
116
-
117
-
118
-
119
-
120
-
121
-
122
-
123
-
124
-
125
-
126
-
127
-
128
-
129
-
130
-
131
-
132
-
133
-
134
-
135
-
136
-
137
-
138
-
139
-
140
-
141
-
142
-
143
-
144
-
145
-
146
-
147
-
148
-
149
-
150
-
151
-
152
-
153
-
154
-
155
-
156
-
157
-
158
-
159
-
160
-
161
-
162
-
163
-
164
-
165
-
166
-
167
-
168
-
169
-
170
-
171
-
172
-
173
-
174
-
175
-
176
-
177
-
178
-
179
-
180
-
181
-
182
-
183
-
184
-
185
-
186
-
187
-
188
-
189
-
190
-
191
-
192
-
193
-
194
-
195
-
196
-
 197
197 -
 198
198 -
 199
199 -
 200
200 -
 201
201 -
 202
202 -
 203
203 -
 204
204 -
 205
205 -
 206
206 -
 207
207 -
 208
208 -
 209
209 -
 210
210 -
 211
211 -
 212
212 -
 213
213 -
 214
214 -
 215
215 -
 216
216 -
 217
217 -
218
-
219
-
220
-
221
-
222
-
223
-
224
-
225
-
226
-
227
-
228
-
229
-
230
-
231
-
232
-
233
-
234
-
235
-
236
-
237
-
238
-
239
-
240
-
241
-
242
-
243
-
244
-
245
-
246
-
247
-
248
-
249
-
250
-
251
-
252
-
253
-
254
-
255
-
256
-
257
-
258
-
259
-
260
-
261
-
262
-
263
-
264
-
265
-
266
-
267
-
268
 |
 |
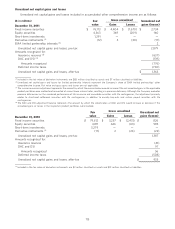
Other investment information
Included in fixed income securities are below investment grade assets totaling $6.01 billion and $6.66 billion as of
December 31, 2011 and 2010, respectively.
As of December 31, 2011, fixed income securities and short-term investments with a carrying value of $293 million
were on deposit with regulatory authorities as required by law.
As of December 31, 2011, the carrying value of fixed income securities and other investments that were non-income
producing was $36 million.
6. Fair Value of Assets and Liabilities
Fair value is defined as the price that would be received to sell an asset or paid to transfer a liability in an orderly
transaction between market participants at the measurement date. The hierarchy for inputs used in determining fair
value maximizes the use of observable inputs and minimizes the use of unobservable inputs by requiring that observable
inputs be used when available. Assets and liabilities recorded on the Consolidated Statements of Financial Position at
fair value are categorized in the fair value hierarchy based on the observability of inputs to the valuation techniques as
follows:
Level 1: Assets and liabilities whose values are based on unadjusted quoted prices for identical assets or liabilities in an
active market that the Company can access.
Level 2: Assets and liabilities whose values are based on the following:
(a) Quoted prices for similar assets or liabilities in active markets;
(b) Quoted prices for identical or similar assets or liabilities in markets that are not active; or
(c) Valuation models whose inputs are observable, directly or indirectly, for substantially the full term of the
asset or liability.
Level 3: Assets and liabilities whose values are based on prices or valuation techniques that require inputs that are both
unobservable and significant to the overall fair value measurement. Unobservable inputs reflect the Company’s
estimates of the assumptions that market participants would use in valuing the assets and liabilities.
The availability of observable inputs varies by instrument. In situations where fair value is based on internally
developed pricing models or inputs that are unobservable in the market, the determination of fair value requires more
judgment. The degree of judgment exercised by the Company in determining fair value is typically greatest for
instruments categorized in Level 3. In many instances, valuation inputs used to measure fair value fall into different
levels of the fair value hierarchy. The category level in the fair value hierarchy is determined based on the lowest level
input that is significant to the fair value measurement in its entirety. The Company uses prices and inputs that are
current as of the measurement date, including during periods of market disruption. In periods of market disruption, the
ability to observe prices and inputs may be reduced for many instruments.
The Company has two types of situations where investments are classified as Level 3 in the fair value hierarchy. The
first is where quotes continue to be received from independent third-party valuation service providers and all significant
inputs are market observable; however, there has been a significant decrease in the volume and level of activity for the
asset when compared to normal market activity such that the degree of market observability has declined to a point
where categorization as a Level 3 measurement is considered appropriate. The indicators considered in determining
whether a significant decrease in the volume and level of activity for a specific asset has occurred include the level of
new issuances in the primary market, trading volume in the secondary market, the level of credit spreads over historical
levels, applicable bid-ask spreads, and price consensus among market participants and other pricing sources.
The second situation where the Company classifies securities in Level 3 is where specific inputs significant to the
fair value estimation models are not market observable. This occurs in two primary instances. The first relates to the
Company’s use of broker quotes to value certain securities where the inputs have not been corroborated to be market
observable. The second relates to auction rate securities (‘‘ARS’’) backed by student loans for which a key input, the
anticipated date liquidity will return to this market, is not market observable.
Certain assets are not carried at fair value on a recurring basis, including investments such as mortgage loans,
limited partnership interests, bank loans and policy loans. Accordingly, such investments are only included in the fair
value hierarchy disclosure when the investment is subject to remeasurement at fair value after initial recognition and the
resulting remeasurement is reflected in the consolidated financial statements. In addition, derivatives embedded in fixed
121