Allstate 2012 Annual Report Download - page 262
Download and view the complete annual report
Please find page 262 of the 2012 Allstate annual report below. You can navigate through the pages in the report by either clicking on the pages listed below, or by using the keyword search tool below to find specific information within the annual report.-
 1
1 -
2
-
3
-
4
-
5
-
6
-
7
-
8
-
9
-
10
-
11
-
12
-
13
-
14
-
15
-
16
-
17
-
18
-
19
-
20
-
21
-
22
-
23
-
24
-
25
-
26
-
27
-
28
-
29
-
30
-
31
-
32
-
33
-
34
-
35
-
36
-
37
-
38
-
39
-
40
-
41
-
42
-
43
-
44
-
45
-
46
-
47
-
48
-
49
-
50
-
51
-
52
-
53
-
54
-
55
-
56
-
57
-
58
-
59
-
60
-
61
-
62
-
63
-
64
-
65
-
66
-
67
-
68
-
69
-
70
-
71
-
72
-
73
-
74
-
75
-
76
-
77
-
78
-
79
-
80
-
81
-
82
-
83
-
84
-
85
-
86
-
87
-
88
-
89
-
90
-
91
-
92
-
93
-
94
-
95
-
96
-
97
-
98
-
99
-
100
-
101
-
102
-
103
-
104
-
105
-
106
-
107
-
108
-
109
-
110
-
111
-
112
-
113
-
114
-
115
-
116
-
117
-
118
-
119
-
120
-
121
-
122
-
123
-
124
-
125
-
126
-
127
-
128
-
129
-
130
-
131
-
132
-
133
-
134
-
135
-
136
-
137
-
138
-
139
-
140
-
141
-
142
-
143
-
144
-
145
-
146
-
147
-
148
-
149
-
150
-
151
-
152
-
153
-
154
-
155
-
156
-
157
-
158
-
159
-
160
-
161
-
162
-
163
-
164
-
165
-
166
-
167
-
168
-
169
-
170
-
171
-
172
-
173
-
174
-
175
-
176
-
177
-
178
-
179
-
180
-
181
-
182
-
183
-
184
-
185
-
186
-
187
-
188
-
189
-
190
-
191
-
192
-
193
-
194
-
195
-
196
-
197
-
198
-
199
-
200
-
201
-
202
-
203
-
204
-
205
-
206
-
207
-
208
-
209
-
210
-
211
-
212
-
213
-
214
-
215
-
216
-
217
-
218
-
219
-
220
-
221
-
222
-
223
-
224
-
225
-
226
-
227
-
228
-
229
-
230
-
231
-
232
-
233
-
234
-
235
-
236
-
237
-
238
-
239
-
240
-
241
-
242
-
243
-
244
-
245
-
246
-
247
-
248
-
249
-
250
-
251
-
 252
252 -
 253
253 -
 254
254 -
 255
255 -
 256
256 -
 257
257 -
 258
258 -
 259
259 -
 260
260 -
 261
261 -
 262
262 -
 263
263 -
 264
264 -
 265
265 -
 266
266 -
 267
267 -
 268
268
 |
 |

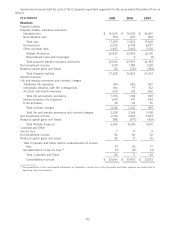
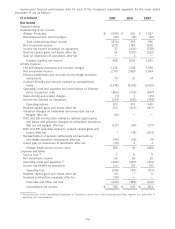
Summarized financial performance data for each of the Company’s reportable segments for the years ended
December 31 are as follows:
($ in millions) 2011 2010 2009
Net income
Property-Liability
Underwriting (loss) income
Allstate Protection $ (849) $ 526 $ 1,027
Discontinued Lines and Coverages (25) (31) (32)
Total underwriting (loss) income (874) 495 995
Net investment income 1,201 1,189 1,328
Income tax benefit (expense) on operations 27 (426) (558)
Realized capital gains and losses, after-tax 54 (207) (222)
Gain on disposition of operations, after-tax — 3 —
Property-Liability net income 408 1,054 1,543
Allstate Financial
Life and annuity premiums and contract charges 2,238 2,168 1,958
Net investment income 2,716 2,853 3,064
Periodic settlements and accruals on non-hedge derivative
instruments 70 51 14
Contract benefits and interest credited to contractholder
funds (3,378) (3,613) (3,655)
Operating costs and expenses and amortization of deferred
policy acquisition costs (865) (755) (867)
Restructuring and related charges (1) 3 (25)
Income tax expense on operations (251) (231) (149)
Operating income 529 476 340
Realized capital gains and losses, after-tax 250 (337) (417)
Valuation changes on embedded derivatives that are not
hedged, after-tax (12) — —
DAC and DSI amortization related to realized capital gains
and losses and valuation changes on embedded derivatives
that are not hedged, after-tax (127) (34) (177)
DAC and DSI unlocking related to realized capital gains and
losses, after-tax 1 (18) (224)
Reclassification of periodic settlements and accruals on
non-hedge derivative instruments, after-tax (45) (33) (9)
(Loss) gain on disposition of operations, after-tax (10) 4 4
Allstate Financial net income (loss) 586 58 (483)
Corporate and Other
Service fees (1) 711 9
Net investment income 54 60 52
Operating costs and expenses (1) (403) (390) (419)
Income tax benefit on operations 126 128 141
Operating loss (216) (191) (217)
Realized capital gains and losses, after-tax 20 7 11
Business combination expenses, after-tax (10) — —
Corporate and Other net loss (206) (184) (206)
Consolidated net income $ 788 $ 928 $ 854
(1) For presentation in the Consolidated Statements of Operations, service fees of the Corporate and Other segment are reclassified to
operating costs and expenses.
176