Allstate 2012 Annual Report Download - page 40
Download and view the complete annual report
Please find page 40 of the 2012 Allstate annual report below. You can navigate through the pages in the report by either clicking on the pages listed below, or by using the keyword search tool below to find specific information within the annual report.-
 1
1 -
2
-
3
-
4
-
5
-
6
-
7
-
8
-
9
-
10
-
11
-
12
-
13
-
14
-
15
-
16
-
17
-
18
-
19
-
20
-
21
-
22
-
23
-
24
-
25
-
26
-
27
-
28
-
29
-
 30
30 -
 31
31 -
 32
32 -
 33
33 -
 34
34 -
 35
35 -
 36
36 -
 37
37 -
 38
38 -
 39
39 -
 40
40 -
 41
41 -
 42
42 -
 43
43 -
 44
44 -
 45
45 -
 46
46 -
 47
47 -
 48
48 -
 49
49 -
 50
50 -
51
-
52
-
53
-
54
-
55
-
56
-
57
-
58
-
59
-
60
-
61
-
62
-
63
-
64
-
65
-
66
-
67
-
68
-
69
-
70
-
71
-
72
-
73
-
74
-
75
-
76
-
77
-
78
-
79
-
80
-
81
-
82
-
83
-
84
-
85
-
86
-
87
-
88
-
89
-
90
-
91
-
92
-
93
-
94
-
95
-
96
-
97
-
98
-
99
-
100
-
101
-
102
-
103
-
104
-
105
-
106
-
107
-
108
-
109
-
110
-
111
-
112
-
113
-
114
-
115
-
116
-
117
-
118
-
119
-
120
-
121
-
122
-
123
-
124
-
125
-
126
-
127
-
128
-
129
-
130
-
131
-
132
-
133
-
134
-
135
-
136
-
137
-
138
-
139
-
140
-
141
-
142
-
143
-
144
-
145
-
146
-
147
-
148
-
149
-
150
-
151
-
152
-
153
-
154
-
155
-
156
-
157
-
158
-
159
-
160
-
161
-
162
-
163
-
164
-
165
-
166
-
167
-
168
-
169
-
170
-
171
-
172
-
173
-
174
-
175
-
176
-
177
-
178
-
179
-
180
-
181
-
182
-
183
-
184
-
185
-
186
-
187
-
188
-
189
-
190
-
191
-
192
-
193
-
194
-
195
-
196
-
197
-
198
-
199
-
200
-
201
-
202
-
203
-
204
-
205
-
206
-
207
-
208
-
209
-
210
-
211
-
212
-
213
-
214
-
215
-
216
-
217
-
218
-
219
-
220
-
221
-
222
-
223
-
224
-
225
-
226
-
227
-
228
-
229
-
230
-
231
-
232
-
233
-
234
-
235
-
236
-
237
-
238
-
239
-
240
-
241
-
242
-
243
-
244
-
245
-
246
-
247
-
248
-
249
-
250
-
251
-
252
-
253
-
254
-
255
-
256
-
257
-
258
-
259
-
260
-
261
-
262
-
263
-
264
-
265
-
266
-
267
-
268
 |
 |

9MAR201204101761
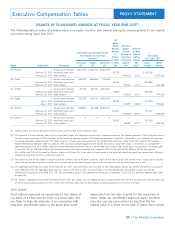
and promoted executives and in recognition of decrease was primarily due to higher catastrophe losses
outstanding achievements. The grant date for awards to at Allstate Protection, partially offset by higher net income
newly hired or promoted executives in 2011 was fixed as from Allstate Financial.
the first business day of a month following the later of Allstate Protection did make significant progress on its
committee action or the date of hire or promotion. strategy to maintain auto profitability and improve
homeowners returns excluding catastrophes. Actions
Performance Measures for 2011 taken to improve homeowners profitability as well as auto
Allstate’s shared vision is to meet the protection and profitability in Florida and New York did reduce Allstate
retirement needs of consumers. Our strategy is to offer brand policies in force, but were necessary to protect
competitively differentiated products and services stockholder value. Customer relationships were broadened
designed to meet the unique needs of each distinct through increased life insurance sales and Good HandsSM
customer segment. In the fourth quarter of 2011, we Roadside Assistance.
completed the acquisition of Esurance and Answer Allstate Financial’s 2011 performance reflected ongoing
Financial, which positions us as the only insurer to serve progress on its strategy to improve overall business
all customer segments with unique value propositions returns while shifting the focus from spread-based
based on whether they are brand-sensitive or brand- products to underwritten products. Net income for 2011
neutral, want an agent’s advice, or prefer to do their own was $586 million compared to $58 million for 2010.
research on the Internet.
Allstate Investments continued to apply a proactive
Our unique strategy approach to risk and return optimization throughout 2011,
focusing on income and delivering solid total returns. Total
portfolio yields were stable in 2011 despite a lower
interest rate environment, reflecting yield enhancement
actions, favorable limited partnership distributions and
equity dividends.
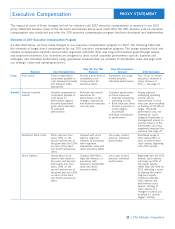
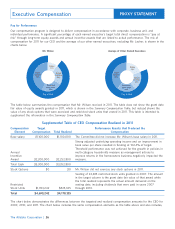
For 2011 annual incentive awards, the Committee used a
single enterprise-wide funding program based on three
equally weighted performance measures. These measures
are consistent with overall shareholder value creation,
growth, and profitability, and encouraged success and
collaboration across business units. The three measures
In 2011, we delivered on our strategy to improve overall also align with Allstate’s strategy and operating priorities
returns and offer unique products for different customer for 2011 related to improving overall returns, growing our
segments. business profitably, and broadening customer
relationships. The three measures are shown in the table
Corporate net income for 2011 was $788 million, or $1.51 below.
per diluted share, compared to $928 million in 2010. The
$31.50 $37.40 $40.75 $36.41 91.6%
$2,700 $2,925 $3,300 $3,214 215.6%
0 50,000 200,000 36,232 0%
Payout* 50% 100% 250% 102.4% payout
* Actual performance below threshold results in a 0% payout.
The ranges of performance for Book Value Per Share and strategic priorities. Our models measured the variability of
Adjusted Underlying Operating Income were developed actual results so that the measures required superior
through statistical modeling and adjusted to reflect performance to achieve maximum levels. The performance
29
Executive Compensation
2011 Annual Cash Incentive Award Performance Measures
Measure Threshold Target Maximum Actual Results
Book Value per Share
Adjusted Underlying Operating Income (in millions)
Growth in Policies in Multi-Category Households
| The Allstate Corporation
PROXY STATEMENT