Allstate 2012 Annual Report Download - page 159
Download and view the complete annual report
Please find page 159 of the 2012 Allstate annual report below. You can navigate through the pages in the report by either clicking on the pages listed below, or by using the keyword search tool below to find specific information within the annual report.-
 1
1 -
2
-
3
-
4
-
5
-
6
-
7
-
8
-
9
-
10
-
11
-
12
-
13
-
14
-
15
-
16
-
17
-
18
-
19
-
20
-
21
-
22
-
23
-
24
-
25
-
26
-
27
-
28
-
29
-
30
-
31
-
32
-
33
-
34
-
35
-
36
-
37
-
38
-
39
-
40
-
41
-
42
-
43
-
44
-
45
-
46
-
47
-
48
-
49
-
50
-
51
-
52
-
53
-
54
-
55
-
56
-
57
-
58
-
59
-
60
-
61
-
62
-
63
-
64
-
65
-
66
-
67
-
68
-
69
-
70
-
71
-
72
-
73
-
74
-
75
-
76
-
77
-
78
-
79
-
80
-
81
-
82
-
83
-
84
-
85
-
86
-
87
-
88
-
89
-
90
-
91
-
92
-
93
-
94
-
95
-
96
-
97
-
98
-
99
-
100
-
101
-
102
-
103
-
104
-
105
-
106
-
107
-
108
-
109
-
110
-
111
-
112
-
113
-
114
-
115
-
116
-
117
-
118
-
119
-
120
-
121
-
122
-
123
-
124
-
125
-
126
-
127
-
128
-
129
-
130
-
131
-
132
-
133
-
134
-
135
-
136
-
137
-
138
-
139
-
140
-
141
-
142
-
143
-
144
-
145
-
146
-
147
-
148
-
 149
149 -
 150
150 -
 151
151 -
 152
152 -
 153
153 -
 154
154 -
 155
155 -
 156
156 -
 157
157 -
 158
158 -
 159
159 -
 160
160 -
 161
161 -
 162
162 -
 163
163 -
 164
164 -
 165
165 -
 166
166 -
 167
167 -
 168
168 -
 169
169 -
170
-
171
-
172
-
173
-
174
-
175
-
176
-
177
-
178
-
179
-
180
-
181
-
182
-
183
-
184
-
185
-
186
-
187
-
188
-
189
-
190
-
191
-
192
-
193
-
194
-
195
-
196
-
197
-
198
-
199
-
200
-
201
-
202
-
203
-
204
-
205
-
206
-
207
-
208
-
209
-
210
-
211
-
212
-
213
-
214
-
215
-
216
-
217
-
218
-
219
-
220
-
221
-
222
-
223
-
224
-
225
-
226
-
227
-
228
-
229
-
230
-
231
-
232
-
233
-
234
-
235
-
236
-
237
-
238
-
239
-
240
-
241
-
242
-
243
-
244
-
245
-
246
-
247
-
248
-
249
-
250
-
251
-
252
-
253
-
254
-
255
-
256
-
257
-
258
-
259
-
260
-
261
-
262
-
263
-
264
-
265
-
266
-
267
-
268
 |
 |

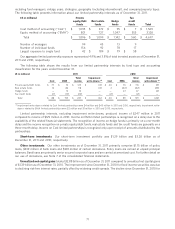
Gross unrealized gains and losses as of December 31, 2011 on fixed income securities by type and sector are
provided in the table below.
($ in millions) Amortized Fair value
cost as a as a
Gross unrealized
Par Amortized Fair percent of percent of
value (1) cost Gains Losses value par value (2) par value (2)
Corporate:
Banking $ 3,649 $ 3,621 $ 96 $ (185) $ 3,532 99.2% 96.8%
Financial services 3,695 3,643 169 (54) 3,758 98.6 101.7
Capital goods 4,878 4,915 372 (32) 5,255 100.8 107.7
Utilities 7,204 7,201 711 (32) 7,880 100.0 109.4
Consumer goods
(cyclical and
non-cyclical) 8,250 8,361 521 (21) 8,861 101.3 107.4
Transportation 1,851 1,858 164 (15) 2,007 100.4 108.4
Communications 2,638 2,647 151 (14) 2,784 100.3 105.5
Basic industry 2,287 2,302 140 (8) 2,434 100.7 106.4
Energy 3,363 3,408 242 (4) 3,646 101.3 108.4
Technology 1,841 1,874 109 (3) 1,980 101.8 107.6
Other 1,491 1,387 68 (11) 1,444 93.0 96.8
Total corporate fixed
income portfolio 41,147 41,217 2,743 (379) 43,581 100.2 105.9
U.S. government and
agencies 6,310 5,966 349 — 6,315 94.5 100.1
Municipal 15,543 13,634 863 (256) 14,241 87.7 91.6
Foreign government 1,951 1,866 216 (1) 2,081 95.6 106.7
RMBS 5,292 4,532 110 (521) 4,121 85.6 77.9
CMBS 2,017 1,962 48 (226) 1,784 97.3 88.4
ABS 4,458 4,180 73 (287) 3,966 93.8 89.0
Redeemable preferred
stock 22 22 2 — 24 100.0 109.1
Total fixed income
securities $ 76,740 $ 73,379 $ 4,404 $ (1,670) $ 76,113 95.6 99.2
(1) Included in par value are zero-coupon securities that are generally purchased at a deep discount to the par value that is received at maturity. These
primarily included corporate, U.S. government and agencies, municipal and foreign government zero-coupon securities with par value of
$514 million, $948 million, $3.48 billion and $382 million, respectively.
(2) Excluding the impact of zero-coupon securities, the percentage of amortized cost to par value would be 100.5% for corporates, 101.4% for U.S.
government and agencies, 101.2% for municipals and 103.3% for foreign governments. Similarly, excluding the impact of zero-coupon securities, the
percentage of fair value to par value would be 106.2% for corporates, 104.7% for U.S. government and agencies, 106.1% for municipals and 111.3%
for foreign governments.
The banking, financial services, and capital goods sectors had the highest concentration of gross unrealized losses
in our corporate fixed income securities portfolio as of December 31, 2011. In general, credit spreads remain wider than
at initial purchase for most of the securities with gross unrealized losses in these categories.
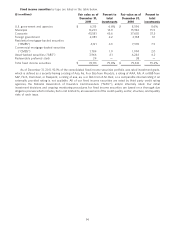
The unrealized net capital gain for the equity portfolio totaled $160 million and comprised $369 million of gross
unrealized gains and $209 million of gross unrealized losses as of December 31, 2011. This is compared to an unrealized
net capital gain for the equity portfolio totaling $583 million, comprised of $646 million of gross unrealized gains and
$63 million of gross unrealized losses as of December 31, 2010.
73