Allstate 2012 Annual Report Download - page 256
Download and view the complete annual report
Please find page 256 of the 2012 Allstate annual report below. You can navigate through the pages in the report by either clicking on the pages listed below, or by using the keyword search tool below to find specific information within the annual report.-
 1
1 -
2
-
3
-
4
-
5
-
6
-
7
-
8
-
9
-
10
-
11
-
12
-
13
-
14
-
15
-
16
-
17
-
18
-
19
-
20
-
21
-
22
-
23
-
24
-
25
-
26
-
27
-
28
-
29
-
30
-
31
-
32
-
33
-
34
-
35
-
36
-
37
-
38
-
39
-
40
-
41
-
42
-
43
-
44
-
45
-
46
-
47
-
48
-
49
-
50
-
51
-
52
-
53
-
54
-
55
-
56
-
57
-
58
-
59
-
60
-
61
-
62
-
63
-
64
-
65
-
66
-
67
-
68
-
69
-
70
-
71
-
72
-
73
-
74
-
75
-
76
-
77
-
78
-
79
-
80
-
81
-
82
-
83
-
84
-
85
-
86
-
87
-
88
-
89
-
90
-
91
-
92
-
93
-
94
-
95
-
96
-
97
-
98
-
99
-
100
-
101
-
102
-
103
-
104
-
105
-
106
-
107
-
108
-
109
-
110
-
111
-
112
-
113
-
114
-
115
-
116
-
117
-
118
-
119
-
120
-
121
-
122
-
123
-
124
-
125
-
126
-
127
-
128
-
129
-
130
-
131
-
132
-
133
-
134
-
135
-
136
-
137
-
138
-
139
-
140
-
141
-
142
-
143
-
144
-
145
-
146
-
147
-
148
-
149
-
150
-
151
-
152
-
153
-
154
-
155
-
156
-
157
-
158
-
159
-
160
-
161
-
162
-
163
-
164
-
165
-
166
-
167
-
168
-
169
-
170
-
171
-
172
-
173
-
174
-
175
-
176
-
177
-
178
-
179
-
180
-
181
-
182
-
183
-
184
-
185
-
186
-
187
-
188
-
189
-
190
-
191
-
192
-
193
-
194
-
195
-
196
-
197
-
198
-
199
-
200
-
201
-
202
-
203
-
204
-
205
-
206
-
207
-
208
-
209
-
210
-
211
-
212
-
213
-
214
-
215
-
216
-
217
-
218
-
219
-
220
-
221
-
222
-
223
-
224
-
225
-
226
-
227
-
228
-
229
-
230
-
231
-
232
-
233
-
234
-
235
-
236
-
237
-
238
-
239
-
240
-
241
-
242
-
243
-
244
-
245
-
 246
246 -
 247
247 -
 248
248 -
 249
249 -
 250
250 -
 251
251 -
 252
252 -
 253
253 -
 254
254 -
 255
255 -
 256
256 -
 257
257 -
 258
258 -
 259
259 -
 260
260 -
 261
261 -
 262
262 -
 263
263 -
 264
264 -
 265
265 -
 266
266 -
267
-
268
 |
 |

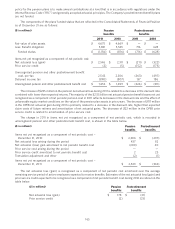
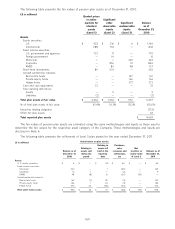
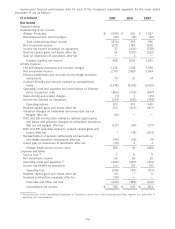
The following table presents the rollforward of Level 3 plan assets for the year ended December 31, 2010.
Actual return on plan assets:
($ in millions)
Relating to Purchases,
Relating to assets still sales, Net
Balance as of assets sold held at the issuances and transfers in Balance as of
December 31, during the reporting settlements, and/or (out) December 31,
2009 period date net of Level 3 2010
Assets
U. S. equity securities $ 4 $ — $ 2 $ — $ — $ 6
Fixed income securities:
Municipal 344 — (2) (114) (6) 222
Corporate 10 — — — — 10
RMBS 61 (10) 23 (26) — 48
ABS 32 (1) — (31) — —
Limited partnership interests:
Real estate funds 135 (4) 3 33 — 167
Private equity funds 149 — 19 (2) — 166
Hedge funds 368 (58) 73 (10) — 373
Total Level 3 plan assets $ 1,103 $ (73) $ 118 $ (150) $ (6) $ 992
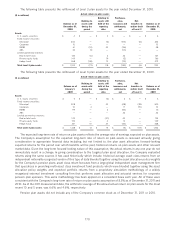
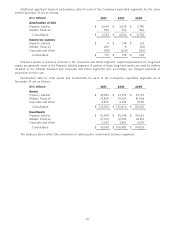
The following table presents the rollforward of Level 3 plan assets for the year ended December 31, 2009.
Actual return on plan assets:
($ in millions)
Relating to Purchases,
Relating to assets still sales, Net
Balance as of assets sold held at the issuances and transfers in Balance as of
January 1, during the reporting settlements, and/or (out) December 31,
2009 period date net of Level 3 2009
Assets
U. S. equity securities $ 5 $ — $ (3) $ 2 $ — $ 4
Fixed income securities:
Municipal 408 — 22 (48) (38) 344
Corporate 10 2 — 17 (19) 10
RMBS 99 — 2 (40) — 61
ABS — — — 32 — 32
Limited partnership interests:
Real estate funds 142 — (47) 40 — 135
Private equity funds 133 — 4 12 — 149
Hedge funds 341 10 37 (20) — 368
Total Level 3 plan assets $ 1,138 $ 12 $ 15 $ (5) $ (57) $ 1,103
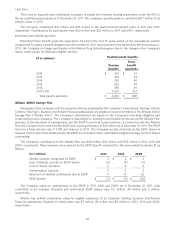
The expected long-term rate of return on plan assets reflects the average rate of earnings expected on plan assets.
The Company’s assumption for the expected long-term rate of return on plan assets is reviewed annually giving
consideration to appropriate financial data including, but not limited to, the plan asset allocation, forward-looking
expected returns for the period over which benefits will be paid, historical returns on plan assets and other relevant
market data. Given the long-term forward looking nature of this assumption, the actual returns in any one year do not
immediately result in a change. In giving consideration to the targeted plan asset allocation, the Company evaluated
returns using the same sources it has used historically which include: historical average asset class returns from an
independent nationally recognized vendor of this type of data blended together using the asset allocation policy weights
for the Company’s pension plans; asset class return forecasts from a large global independent asset management firm
that specializes in providing multi-asset class investment fund products which were blended together using the asset
allocation policy weights; and expected portfolio returns from a proprietary simulation methodology of a widely
recognized external investment consulting firm that performs asset allocation and actuarial services for corporate
pension plan sponsors. This same methodology has been applied on a consistent basis each year. All of these were
consistent with the Company’s long-term rate of return on plan assets assumption of 8.5% as of December 31, 2011 and
2010. As of the 2011 measurement date, the arithmetic average of the annual actual return on plan assets for the most
recent 10 and 5 years was 6.6% and 4.6%, respectively.
Pension plan assets did not include any of the Company’s common stock as of December 31, 2011 or 2010.
170