Allstate 2012 Annual Report Download - page 125
Download and view the complete annual report
Please find page 125 of the 2012 Allstate annual report below. You can navigate through the pages in the report by either clicking on the pages listed below, or by using the keyword search tool below to find specific information within the annual report.-
 1
1 -
2
-
3
-
4
-
5
-
6
-
7
-
8
-
9
-
10
-
11
-
12
-
13
-
14
-
15
-
16
-
17
-
18
-
19
-
20
-
21
-
22
-
23
-
24
-
25
-
26
-
27
-
28
-
29
-
30
-
31
-
32
-
33
-
34
-
35
-
36
-
37
-
38
-
39
-
40
-
41
-
42
-
43
-
44
-
45
-
46
-
47
-
48
-
49
-
50
-
51
-
52
-
53
-
54
-
55
-
56
-
57
-
58
-
59
-
60
-
61
-
62
-
63
-
64
-
65
-
66
-
67
-
68
-
69
-
70
-
71
-
72
-
73
-
74
-
75
-
76
-
77
-
78
-
79
-
80
-
81
-
82
-
83
-
84
-
85
-
86
-
87
-
88
-
89
-
90
-
91
-
92
-
93
-
94
-
95
-
96
-
97
-
98
-
99
-
100
-
101
-
102
-
103
-
104
-
105
-
106
-
107
-
108
-
109
-
110
-
111
-
112
-
113
-
114
-
 115
115 -
 116
116 -
 117
117 -
 118
118 -
 119
119 -
 120
120 -
 121
121 -
 122
122 -
 123
123 -
 124
124 -
 125
125 -
 126
126 -
 127
127 -
 128
128 -
 129
129 -
 130
130 -
 131
131 -
 132
132 -
 133
133 -
 134
134 -
 135
135 -
136
-
137
-
138
-
139
-
140
-
141
-
142
-
143
-
144
-
145
-
146
-
147
-
148
-
149
-
150
-
151
-
152
-
153
-
154
-
155
-
156
-
157
-
158
-
159
-
160
-
161
-
162
-
163
-
164
-
165
-
166
-
167
-
168
-
169
-
170
-
171
-
172
-
173
-
174
-
175
-
176
-
177
-
178
-
179
-
180
-
181
-
182
-
183
-
184
-
185
-
186
-
187
-
188
-
189
-
190
-
191
-
192
-
193
-
194
-
195
-
196
-
197
-
198
-
199
-
200
-
201
-
202
-
203
-
204
-
205
-
206
-
207
-
208
-
209
-
210
-
211
-
212
-
213
-
214
-
215
-
216
-
217
-
218
-
219
-
220
-
221
-
222
-
223
-
224
-
225
-
226
-
227
-
228
-
229
-
230
-
231
-
232
-
233
-
234
-
235
-
236
-
237
-
238
-
239
-
240
-
241
-
242
-
243
-
244
-
245
-
246
-
247
-
248
-
249
-
250
-
251
-
252
-
253
-
254
-
255
-
256
-
257
-
258
-
259
-
260
-
261
-
262
-
263
-
264
-
265
-
266
-
267
-
268
 |
 |

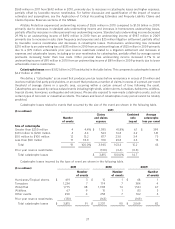
favorable reserve reestimates and lower catastrophe losses. The increase is primarily driven by increases in Florida and
New York. In 2010, claim frequencies in the bodily injury and physical damage coverages have increased compared to
2009, but remain within historical norms. Bodily injury and physical damage coverages severity results in 2010
increased in line with historical CPI trends.
Homeowners loss ratio for the Allstate brand increased 15.9 points to 98.0 in 2011 from 82.1 in 2010 due to higher
catastrophe losses. Excluding the impact of catastrophe losses, the Allstate brand homeowners loss ratio improved 2.8
points in 2011 compared to 2010 due to average earned premiums increasing faster than loss costs. Homeowners loss
ratio for the Allstate brand increased 2.5 points to 82.1 in 2010 from 79.6 in 2009 due to a $75 million unfavorable prior
year reserve reestimate related to a litigation settlement and higher catastrophe losses including prior year reserve
reestimates for catastrophes, partially offset by average earned premiums increasing faster than loss costs.
Expense ratio for Allstate Protection increased 0.6 points in 2011 compared to 2010. Restructuring costs increased
0.1 points in 2011 compared to 2010, driven by technology and operations efficiency efforts and agent pension plan
settlement charges. Excluding restructuring, the expense ratio for Allstate Protection increased 0.5 points in 2011
compared to 2010, driven by additional marketing, including $78 million spent on the Grow to Win initiative, and other
growth initiative costs, and reduced guaranty fund accrual levels in 2010. We expect advertising costs to increase in
2012 as we focus on growing Esurance. The expense ratio for Allstate Protection increased 0.5 points in 2010 compared
to 2009. Restructuring costs decreased 0.3 points in 2010 compared to 2009, driven by prior year costs associated with
claim office consolidations, reorganization of Business Insurance and technology prioritization and efficiency efforts.
Excluding restructuring, the expense ratio for Allstate Protection increased 0.8 points in 2010 compared to 2009, driven
by additional marketing expenses and increases in net costs of employee benefits, partially offset by reduced guaranty
fund accrual levels and improved operational efficiencies.
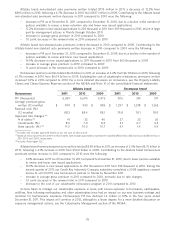
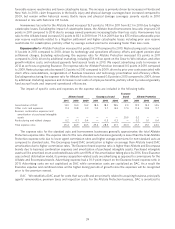
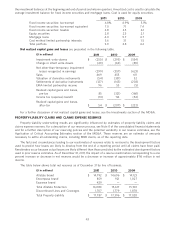
The impact of specific costs and expenses on the expense ratio are included in the following table.
Esurance
Allstate brand Encompass brand brand Allstate Protection
2011 2010 2009 2011 2010 2009 2011 2011 2010 2009
Amortization of DAC 13.9 14.0 14.2 18.0 18.3 18.5 2.0 13.9 14.2 14.5
Other costs and expenses 11.3 10.8 9.9 11.2 9.7 8.3 17.4 11.4 10.8 9.7
Business combination expenses and
amortization of purchased intangible
assets ——————20.9 0.2 — —
Restructuring and related charges 0.2 0.1 0.4 — 0.5 0.3 — 0.2 0.1 0.4
Total expense ratio 25.4 24.9 24.5 29.2 28.5 27.1 40.3 25.7 25.1 24.6
The expense ratio for the standard auto and homeowners businesses generally approximates the total Allstate
Protection expense ratio. The expense ratio for the non-standard auto business generally is lower than the total Allstate
Protection expense ratio due to lower agent commission rates and higher average premiums for non-standard auto as
compared to standard auto. The Encompass brand DAC amortization is higher on average than Allstate brand DAC
amortization due to higher commission rates. The Esurance brand expense ratio is higher than Allstate and Encompass
brands due to business combination expenses and amortization of purchased intangible assets. Purchased intangible
assets will be amortized on an accelerated basis with over 80% of the amortization taking place by 2016. Since Esurance
uses a direct distribution model, its primary acquisition-related costs are advertising as opposed to commissions for the
Allstate and Encompass brands. Advertising expense had a 10.9 point impact on the Esurance brand expense ratio in
2011. Advertising costs are not capitalized as DAC while commission costs are capitalized as DAC. As a result the
Esurance expense and combined ratios will be higher during periods of growth since the expenses will be recognized
prior to the premium earned.
DAC We establish a DAC asset for costs that vary with and are primarily related to acquiring business, principally
agents’ remuneration, premium taxes and inspection costs. For the Allstate Protection business, DAC is amortized to
39