Allstate 2012 Annual Report Download - page 50
Download and view the complete annual report
Please find page 50 of the 2012 Allstate annual report below. You can navigate through the pages in the report by either clicking on the pages listed below, or by using the keyword search tool below to find specific information within the annual report.-
 1
1 -
2
-
3
-
4
-
5
-
6
-
7
-
8
-
9
-
10
-
11
-
12
-
13
-
14
-
15
-
16
-
17
-
18
-
19
-
20
-
21
-
22
-
23
-
24
-
25
-
26
-
27
-
28
-
29
-
30
-
31
-
32
-
33
-
34
-
35
-
36
-
37
-
38
-
39
-
 40
40 -
 41
41 -
 42
42 -
 43
43 -
 44
44 -
 45
45 -
 46
46 -
 47
47 -
 48
48 -
 49
49 -
 50
50 -
 51
51 -
 52
52 -
 53
53 -
 54
54 -
 55
55 -
 56
56 -
 57
57 -
 58
58 -
 59
59 -
 60
60 -
61
-
62
-
63
-
64
-
65
-
66
-
67
-
68
-
69
-
70
-
71
-
72
-
73
-
74
-
75
-
76
-
77
-
78
-
79
-
80
-
81
-
82
-
83
-
84
-
85
-
86
-
87
-
88
-
89
-
90
-
91
-
92
-
93
-
94
-
95
-
96
-
97
-
98
-
99
-
100
-
101
-
102
-
103
-
104
-
105
-
106
-
107
-
108
-
109
-
110
-
111
-
112
-
113
-
114
-
115
-
116
-
117
-
118
-
119
-
120
-
121
-
122
-
123
-
124
-
125
-
126
-
127
-
128
-
129
-
130
-
131
-
132
-
133
-
134
-
135
-
136
-
137
-
138
-
139
-
140
-
141
-
142
-
143
-
144
-
145
-
146
-
147
-
148
-
149
-
150
-
151
-
152
-
153
-
154
-
155
-
156
-
157
-
158
-
159
-
160
-
161
-
162
-
163
-
164
-
165
-
166
-
167
-
168
-
169
-
170
-
171
-
172
-
173
-
174
-
175
-
176
-
177
-
178
-
179
-
180
-
181
-
182
-
183
-
184
-
185
-
186
-
187
-
188
-
189
-
190
-
191
-
192
-
193
-
194
-
195
-
196
-
197
-
198
-
199
-
200
-
201
-
202
-
203
-
204
-
205
-
206
-
207
-
208
-
209
-
210
-
211
-
212
-
213
-
214
-
215
-
216
-
217
-
218
-
219
-
220
-
221
-
222
-
223
-
224
-
225
-
226
-
227
-
228
-
229
-
230
-
231
-
232
-
233
-
234
-
235
-
236
-
237
-
238
-
239
-
240
-
241
-
242
-
243
-
244
-
245
-
246
-
247
-
248
-
249
-
250
-
251
-
252
-
253
-
254
-
255
-
256
-
257
-
258
-
259
-
260
-
261
-
262
-
263
-
264
-
265
-
266
-
267
-
268
 |
 |

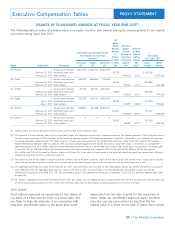
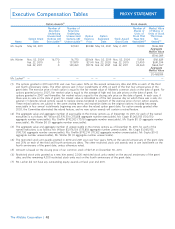
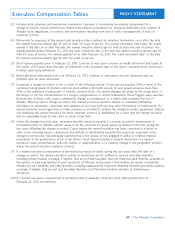
GRANTS OF PLAN-BASED AWARDS AT FISCAL YEAR-END 2011(1)
The following table provides information about non-equity incentive plan awards and equity awards granted to our named
executives during fiscal year 2011.
Mr. Wilson — Annual cash incentive 1,100,000 2,200,000 8,500,000
February 22, 2011 Restricted stock units 72,779 2,310,005
February 22, 2011 Stock options 447,808 31.74 4,290,001
Mr. Civgin — Annual cash incentive 343,327 686,654 1,716,635
February 22, 2011 Restricted stock units 18,746 594,998
February 22, 2011 Stock options 115,344 31.74 1,104,996
Ms. Greffin — Annual cash incentive 317,731 635,461 4,821,000
February 22, 2011 Restricted stock units 16,871 535,486
February 22, 2011 Stock options 103,810 31.74 994,500
Mr. Gupta — Annual cash incentive 223,125 446,150 6,428,000
May 2, 2011 Restricted stock units 19,923 674,991
May 2, 2011 Stock options 92,593 33.88 975,004
Mr. Winter — Annual cash incentive 408,894 817,788 6,428,000
February 22, 2011 Restricted stock units 24,260 770,012
February 22, 2011 Stock options 149,269 31.74 1,429,997
Mr. Lacher(5) — Annual cash incentive 0 0 0
February 22, 2011 Restricted stock units 23,433 743,763
February 22, 2011 Stock options 144,181 31.74 1,381,254
(1) Awards under the Annual Executive Incentive Plan and the 2009 Equity Incentive Plan.
(2) The amounts in these columns consist of the threshold, target, and maximum annual cash incentive awards for the named executives. The threshold amount
for each named executive is 50% of target, as the minimum amount payable if threshold performance is achieved. If threshold is not achieved, the payment
to named executives would be zero. The target amount is based upon achievement of the performance measures listed in the 2011 Annual Cash Incentive
Awards Performance Measures table on page 30. The maximum amount payable to the named executives, except Mr. Civgin, is the lesser of a stockholder
approved maximum of $8.5 million under the Annual Executive Incentive Plan or a percentage of the award pool, which varies by executive. The award pool
is equal to 1.0% of Adjusted Underlying Operating Income with award opportunities capped at 45% of the pool for Mr. Wilson, 15% of the pool for
Ms. Greffin, and 20% of the pool for Messrs. Gupta and Winter. Mr. Civgin does not participate in the adjusted underlying operating income pool. Adjusted
Underlying Operating income is defined on page 52.
(3) The exercise price of each option is equal to the fair market value of Allstate’s common stock on the date of grant. Fair market value is equal to the closing
sale price on the date of grant or, if there was no such sale on the date of grant, then on the last previous day on which there was a sale.
(4) The aggregate grant date fair value of the February 22, 2011, restricted stock units was $31.74 and stock option awards was $9.58, computed in accordance
with FASB ASC 718. The aggregate grant date fair value of the May 2, 2011, restricted stock units was $33.88 and stock option awards was $10.53,
computed in accordance with FASB ASC 718. The assumptions used in the valuation are discussed in footnotes 3 and 4 to the Summary Compensation Table
on page 36.
(5) Mr. Lacher’s employment terminated effective July 17, 2011. Mr. Lacher was not eligible to earn an award under the 2011 Annual Executive Incentive Plan, and
all of the equity awards granted to him in 2011 were forfeited, along with all other equity awards granted to him since his hire date.
Stock options
Stock options represent an opportunity to buy shares of appreciate from the date of grant for the executives to
our stock at a fixed exercise price at a future date. We profit. Under our stockholder-approved equity incentive
use them to align the interests of our executives with plan, the exercise price cannot be less than the fair
long-term stockholder value, as the stock price must market value of a share on the date of grant. Stock option
39
All
Other
Stock All Other
Awards: Option Exercise
Number Awards: or Base
of Number of Price of
Shares Securities Option
of Stock Underlying Awards
Threshold Target Maximum or Units Options ($/ Stock Option
Name Grant Date Plan Name ($) ($) ($) (#) (#) Shr)(3) Awards Awards
Executive Compensation Tables
| The Allstate Corporation
PROXY STATEMENT
Estimated Future Payouts Under
Non-Equity Incentive Plan Grant Date
Awards(2) Fair Value ($)(4)