Allstate 2012 Annual Report Download - page 36
Download and view the complete annual report
Please find page 36 of the 2012 Allstate annual report below. You can navigate through the pages in the report by either clicking on the pages listed below, or by using the keyword search tool below to find specific information within the annual report.-
 1
1 -
2
-
3
-
4
-
5
-
6
-
7
-
8
-
9
-
10
-
11
-
12
-
13
-
14
-
15
-
16
-
17
-
18
-
19
-
20
-
21
-
22
-
23
-
24
-
25
-
 26
26 -
 27
27 -
 28
28 -
 29
29 -
 30
30 -
 31
31 -
 32
32 -
 33
33 -
 34
34 -
 35
35 -
 36
36 -
 37
37 -
 38
38 -
 39
39 -
 40
40 -
 41
41 -
 42
42 -
 43
43 -
 44
44 -
 45
45 -
 46
46 -
47
-
48
-
49
-
50
-
51
-
52
-
53
-
54
-
55
-
56
-
57
-
58
-
59
-
60
-
61
-
62
-
63
-
64
-
65
-
66
-
67
-
68
-
69
-
70
-
71
-
72
-
73
-
74
-
75
-
76
-
77
-
78
-
79
-
80
-
81
-
82
-
83
-
84
-
85
-
86
-
87
-
88
-
89
-
90
-
91
-
92
-
93
-
94
-
95
-
96
-
97
-
98
-
99
-
100
-
101
-
102
-
103
-
104
-
105
-
106
-
107
-
108
-
109
-
110
-
111
-
112
-
113
-
114
-
115
-
116
-
117
-
118
-
119
-
120
-
121
-
122
-
123
-
124
-
125
-
126
-
127
-
128
-
129
-
130
-
131
-
132
-
133
-
134
-
135
-
136
-
137
-
138
-
139
-
140
-
141
-
142
-
143
-
144
-
145
-
146
-
147
-
148
-
149
-
150
-
151
-
152
-
153
-
154
-
155
-
156
-
157
-
158
-
159
-
160
-
161
-
162
-
163
-
164
-
165
-
166
-
167
-
168
-
169
-
170
-
171
-
172
-
173
-
174
-
175
-
176
-
177
-
178
-
179
-
180
-
181
-
182
-
183
-
184
-
185
-
186
-
187
-
188
-
189
-
190
-
191
-
192
-
193
-
194
-
195
-
196
-
197
-
198
-
199
-
200
-
201
-
202
-
203
-
204
-
205
-
206
-
207
-
208
-
209
-
210
-
211
-
212
-
213
-
214
-
215
-
216
-
217
-
218
-
219
-
220
-
221
-
222
-
223
-
224
-
225
-
226
-
227
-
228
-
229
-
230
-
231
-
232
-
233
-
234
-
235
-
236
-
237
-
238
-
239
-
240
-
241
-
242
-
243
-
244
-
245
-
246
-
247
-
248
-
249
-
250
-
251
-
252
-
253
-
254
-
255
-
256
-
257
-
258
-
259
-
260
-
261
-
262
-
263
-
264
-
265
-
266
-
267
-
268
 |
 |

The impact of some of these changes will not be reflected until 2012 executive compensation is reported in our 2013
proxy statement because many of the decisions summarized above were made after the 2011 advisory vote on executive
compensation was conducted and after the 2011 executive compensation program had been developed and implemented.
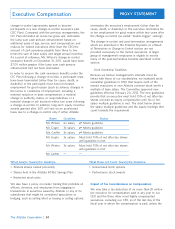
Elements of 2011 Executive Compensation Program
As described above, we have made changes to our executive compensation program for 2012. The following table lists
the elements of target direct compensation for our 2011 executive compensation program. The design balances fixed and
variable compensation elements and provides alignment with both short and long-term business goals through annual
and long-term incentives. Our incentives are designed to drive overall corporate performance, specific business unit
strategies, and individual performance using operational measures that we correlate to stockholder value and align with
our strategic vision and operating priorities.
Base salary Fixed compensation Provide a base level of Experience, job scope, Four of our six named
component payable in competitive cash market practice, executives received a
cash. Reviewed annually compensation for individual performance. salary increase in
and adjusted when executive talent. 2011 — see page 31.
appropriate.
Annual incentive Variable compensation Motivate and reward Company performance Strong adjusted
awards component payable in executives for on three measures: underlying operating
cash based on performance on key • Adjusted underlying income and an
performance against strategic, operational, operating income improvement in book
annually established and financial measures • Book value per share value per share resulted
goals and assessment over the year. • Growth in policies in in funding at 102.4% of
of individual multi-category target. Threshold
performance. households performance was not
Individual contribution achieved for multi-
to performance. category households as
management actions to
improve returns in the
homeowners business
negatively impacted this
measure. See page 29.
Restricted Stock Units RSUs vest over four Coupled with stock Job scope, market Eliminated usage of
years; 50% on the options, align the practice, individual time vested RSUs in
second anniversary of interests of executives performance. favor of performance
the grant date and 25% with long-term stock awards beginning
on each of the third shareholder value and with 2012 awards.
and fourth anniversary retain executive talent.
dates.
Stock Options Nonqualified stock Coupled with RSUs, Job scope, market Beginning with the 2012
options that expire in align the interests of practice, individual awards, stock options
ten years and become executives with performance. will make up 50% of
exercisable over four long-term shareholder the equity awards
years; 50% on the value and retain rather than the 65% for
second anniversary of executive talent. 2011, reflecting a move
the grant date and 25% to balance the overall
on each of the third long-term equity
and fourth anniversary incentives between
dates. stock options and
performance stock
awards. Vesting of
stock options in a
change-in-control was
modified to ‘‘double-
trigger’’ vesting.
25
Executive Compensation
Fixed
Variable
| The Allstate Corporation
PROXY STATEMENT
Why We Pay This How We Determine
Element Key Characteristics Element Amount 2011 Decisions