Allstate 2012 Annual Report Download - page 212
Download and view the complete annual report
Please find page 212 of the 2012 Allstate annual report below. You can navigate through the pages in the report by either clicking on the pages listed below, or by using the keyword search tool below to find specific information within the annual report.-
 1
1 -
2
-
3
-
4
-
5
-
6
-
7
-
8
-
9
-
10
-
11
-
12
-
13
-
14
-
15
-
16
-
17
-
18
-
19
-
20
-
21
-
22
-
23
-
24
-
25
-
26
-
27
-
28
-
29
-
30
-
31
-
32
-
33
-
34
-
35
-
36
-
37
-
38
-
39
-
40
-
41
-
42
-
43
-
44
-
45
-
46
-
47
-
48
-
49
-
50
-
51
-
52
-
53
-
54
-
55
-
56
-
57
-
58
-
59
-
60
-
61
-
62
-
63
-
64
-
65
-
66
-
67
-
68
-
69
-
70
-
71
-
72
-
73
-
74
-
75
-
76
-
77
-
78
-
79
-
80
-
81
-
82
-
83
-
84
-
85
-
86
-
87
-
88
-
89
-
90
-
91
-
92
-
93
-
94
-
95
-
96
-
97
-
98
-
99
-
100
-
101
-
102
-
103
-
104
-
105
-
106
-
107
-
108
-
109
-
110
-
111
-
112
-
113
-
114
-
115
-
116
-
117
-
118
-
119
-
120
-
121
-
122
-
123
-
124
-
125
-
126
-
127
-
128
-
129
-
130
-
131
-
132
-
133
-
134
-
135
-
136
-
137
-
138
-
139
-
140
-
141
-
142
-
143
-
144
-
145
-
146
-
147
-
148
-
149
-
150
-
151
-
152
-
153
-
154
-
155
-
156
-
157
-
158
-
159
-
160
-
161
-
162
-
163
-
164
-
165
-
166
-
167
-
168
-
169
-
170
-
171
-
172
-
173
-
174
-
175
-
176
-
177
-
178
-
179
-
180
-
181
-
182
-
183
-
184
-
185
-
186
-
187
-
188
-
189
-
190
-
191
-
192
-
193
-
194
-
195
-
196
-
197
-
198
-
199
-
200
-
201
-
 202
202 -
 203
203 -
 204
204 -
 205
205 -
 206
206 -
 207
207 -
 208
208 -
 209
209 -
 210
210 -
 211
211 -
 212
212 -
 213
213 -
 214
214 -
 215
215 -
 216
216 -
 217
217 -
 218
218 -
 219
219 -
 220
220 -
 221
221 -
 222
222 -
223
-
224
-
225
-
226
-
227
-
228
-
229
-
230
-
231
-
232
-
233
-
234
-
235
-
236
-
237
-
238
-
239
-
240
-
241
-
242
-
243
-
244
-
245
-
246
-
247
-
248
-
249
-
250
-
251
-
252
-
253
-
254
-
255
-
256
-
257
-
258
-
259
-
260
-
261
-
262
-
263
-
264
-
265
-
266
-
267
-
268
 |
 |

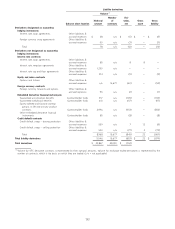
The following table presents the rollforward of Level 3 assets and liabilities held at fair value on a recurring basis
during the year ended December 31, 2011.
($ in millions) Total realized and
unrealized gains (losses)
included in:
OCI on
Balance as of Statement of Transfers Transfers
December 31, Net Financial into out of
2010 income (1) Position Level 3 Level 3
Assets
Fixed income securities:
Municipal $ 2,016 $ (44) $ 54 $ 70 $ (82)
Corporate 1,908 62 (44) 239 (523)
RMBS 1,794 (86) 107 — (1,256)
CMBS 923 (43) 113 86 (966)
ABS 2,417 23 (65) — (2,137)
Redeemable preferred stock 1 ————
Total fixed income securities 9,059 (88) 165 395 (4,964)
Equity securities 63 (10) — — (10)
Other investments:
Free-standing derivatives, net (21) (91) — — —
Other assets 1 ————
Total recurring Level 3 assets $ 9,102 $ (189) $ 165 $ 395 $ (4,974)
Liabilities
Contractholder funds:
Derivatives embedded in life and
annuity contracts $ (653) $ (134) $ — $ — $ —
Total recurring Level 3 liabilities $ (653) $ (134) $ — $ — $ —
Balance as of
December 31,
Purchases Sales Issuances Settlements 2011
Assets
Fixed income securities:
Municipal $ 14 $ (689) $ — $ (7) $ 1,332
Corporate 387 (537) — (87) 1,405
RMBS 4 (378) — (134) 51
CMBS 17 (66) — (4) 60
ABS 504 (169) — (276) 297
Redeemable preferred stock ———— 1
Total fixed income securities 926 (1,839) — (508) 3,146
Equity securities 1 (1) — — 43
Other investments:
Free-standing derivatives, net 70 — — (53) (95) (2)
Other assets ———— 1
Total recurring Level 3 assets $ 997 $ (1,840) $ — $ (561) $ 3,095
Liabilities
Contractholder funds:
Derivatives embedded in life and
annuity contracts $ — $ — $ (100) $ 164 $ (723)
Total recurring Level 3 liabilities $ — $ — $ (100) $ 164 $ (723)
(1) The effect to net income totals $(323) million and is reported in the Consolidated Statements of Operations as follows: $(221) million in realized
capital gains and losses, $36 million in net investment income, $(106) million in interest credited to contractholder funds and $(32) million in life
and annuity contract benefits.
(2) Comprises $1 million of assets and $96 million of liabilities.
126