Allstate 2012 Annual Report Download - page 174
Download and view the complete annual report
Please find page 174 of the 2012 Allstate annual report below. You can navigate through the pages in the report by either clicking on the pages listed below, or by using the keyword search tool below to find specific information within the annual report.-
 1
1 -
2
-
3
-
4
-
5
-
6
-
7
-
8
-
9
-
10
-
11
-
12
-
13
-
14
-
15
-
16
-
17
-
18
-
19
-
20
-
21
-
22
-
23
-
24
-
25
-
26
-
27
-
28
-
29
-
30
-
31
-
32
-
33
-
34
-
35
-
36
-
37
-
38
-
39
-
40
-
41
-
42
-
43
-
44
-
45
-
46
-
47
-
48
-
49
-
50
-
51
-
52
-
53
-
54
-
55
-
56
-
57
-
58
-
59
-
60
-
61
-
62
-
63
-
64
-
65
-
66
-
67
-
68
-
69
-
70
-
71
-
72
-
73
-
74
-
75
-
76
-
77
-
78
-
79
-
80
-
81
-
82
-
83
-
84
-
85
-
86
-
87
-
88
-
89
-
90
-
91
-
92
-
93
-
94
-
95
-
96
-
97
-
98
-
99
-
100
-
101
-
102
-
103
-
104
-
105
-
106
-
107
-
108
-
109
-
110
-
111
-
112
-
113
-
114
-
115
-
116
-
117
-
118
-
119
-
120
-
121
-
122
-
123
-
124
-
125
-
126
-
127
-
128
-
129
-
130
-
131
-
132
-
133
-
134
-
135
-
136
-
137
-
138
-
139
-
140
-
141
-
142
-
143
-
144
-
145
-
146
-
147
-
148
-
149
-
150
-
151
-
152
-
153
-
154
-
155
-
156
-
157
-
158
-
159
-
160
-
161
-
162
-
163
-
 164
164 -
 165
165 -
 166
166 -
 167
167 -
 168
168 -
 169
169 -
 170
170 -
 171
171 -
 172
172 -
 173
173 -
 174
174 -
 175
175 -
 176
176 -
 177
177 -
 178
178 -
 179
179 -
 180
180 -
 181
181 -
 182
182 -
 183
183 -
 184
184 -
185
-
186
-
187
-
188
-
189
-
190
-
191
-
192
-
193
-
194
-
195
-
196
-
197
-
198
-
199
-
200
-
201
-
202
-
203
-
204
-
205
-
206
-
207
-
208
-
209
-
210
-
211
-
212
-
213
-
214
-
215
-
216
-
217
-
218
-
219
-
220
-
221
-
222
-
223
-
224
-
225
-
226
-
227
-
228
-
229
-
230
-
231
-
232
-
233
-
234
-
235
-
236
-
237
-
238
-
239
-
240
-
241
-
242
-
243
-
244
-
245
-
246
-
247
-
248
-
249
-
250
-
251
-
252
-
253
-
254
-
255
-
256
-
257
-
258
-
259
-
260
-
261
-
262
-
263
-
264
-
265
-
266
-
267
-
268
 |
 |
strength rating of AA- and ALIC’s financial strength rating of A+. The outlook for all S&P ratings was revised to negative
from stable. On January 26, 2012, A.M. Best affirmed The Allstate Corporation’s debt and commercial paper ratings of
a- and AMB-1, respectively, and our insurance entities financial strength ratings of A+ for AIC and ALIC. The outlook for
AIC is stable and ALIC was revised to stable from negative. A.M. Best also gives our legal entities that are fully reinsured
the financial strength rating of the assuming company.
We have distinct and separately capitalized groups of subsidiaries licensed to sell property and casualty insurance
in New Jersey and Florida that maintain separate group ratings. The ratings of these groups are influenced by the risks
that relate specifically to each group. Many mortgage companies require property owners to have insurance from an
insurance carrier with a secure financial strength rating from an accredited rating agency. Allstate New Jersey Insurance
Company, which writes auto and homeowners insurance, is rated A- by A.M. Best. The outlook for this rating is stable.
Allstate New Jersey Insurance Company also has a Financial Stability Rating of A’’ from Demotech, which was affirmed
on November 16, 2011. Castle Key Insurance Company, which underwrites personal lines property insurance in Florida, is
rated B- by A.M. Best. The outlook for the rating is negative. Castle Key Insurance Company also has a Financial Stability
Rating of A’ from Demotech, which was affirmed on November 16, 2011.
ALIC, AIC and The Allstate Corporation are party to the Amended and Restated Intercompany Liquidity Agreement
(‘‘Liquidity Agreement’’) which allows for short-term advances of funds to be made between parties for liquidity and
other general corporate purposes. The Liquidity Agreement does not establish a commitment to advance funds on the
part of any party. ALIC and AIC each serve as a lender and borrower and the Corporation serves only as a lender. AIC
also has a capital support agreement with ALIC. Under the capital support agreement, AIC is committed to provide
capital to ALIC to maintain an adequate capital level. The maximum amount of potential funding under each of these
agreements is $1.00 billion.
In addition to the Liquidity Agreement, the Corporation also has an intercompany loan agreement with certain of its
subsidiaries, which include, but are not limited to, AIC and ALIC. The amount of intercompany loans available to the
Corporation’s subsidiaries is at the discretion of the Corporation. The maximum amount of loans the Corporation will
have outstanding to all its eligible subsidiaries at any given point in time is limited to $1.00 billion. The Corporation may
use commercial paper borrowings, bank lines of credit and securities lending to fund intercompany borrowings.
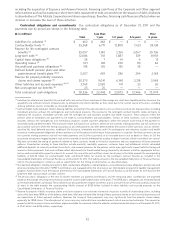
Allstate’s domestic property-liability and life insurance subsidiaries prepare their statutory-basis financial
statements in conformity with accounting practices prescribed or permitted by the insurance department of the
applicable state of domicile. Statutory surplus is a measure that is often used as a basis for determining dividend paying
capacity, operating leverage and premium growth capacity, and it is also reviewed by rating agencies in determining
their ratings. As of December 31, 2011, AIC’s statutory surplus is approximately $15.13 billion compared to $15.38 billion
as of December 31, 2010. These amounts include ALIC’s statutory surplus of approximately $3.46 billion as of
December 31, 2011, compared to $3.34 billion as of December 31, 2010.
The ratio of net premiums written to statutory surplus is a common measure of operating leverage used in the
property-casualty insurance industry and serves as an indicator of a company’s premium growth capacity. Ratios in
excess of 3 to 1 are typically considered outside the usual range by insurance regulators and rating agencies, and for
homeowners and related coverages that have significant net exposure to natural catastrophes a ratio of 1 to 1 is
considered appropriate. AIC’s premium to surplus ratio was 1.6x as of December 31, 2011 and 2010.
State laws specify regulatory actions if an insurer’s risk-based capital (‘‘RBC’’), a measure of an insurer’s solvency,
falls below certain levels. The NAIC has a standard formula for annually assessing RBC. The formula for calculating RBC
for property-liability companies takes into account asset and credit risks but places more emphasis on underwriting
factors for reserving and pricing. The formula for calculating RBC for life insurance companies takes into account factors
relating to insurance, business, asset and interest rate risks. As of December 31, 2011, the RBC for each of our domestic
insurance companies was within the range that we target.
The NAIC has also developed a set of financial relationships or tests known as the Insurance Regulatory Information
System to assist state regulators in monitoring the financial condition of insurance companies and identifying
companies that require special attention or actions by insurance regulatory authorities. The NAIC analyzes financial
data provided by insurance companies using prescribed ratios, each with defined ‘‘usual ranges’’. Generally, regulators
will begin to monitor an insurance company if its ratios fall outside the usual ranges for four or more of the ratios. If an
insurance company has insufficient capital, regulators may act to reduce the amount of insurance it can issue. The ratios
of our domestic insurance companies are within these ranges.
88