Allstate 2012 Annual Report Download - page 251
Download and view the complete annual report
Please find page 251 of the 2012 Allstate annual report below. You can navigate through the pages in the report by either clicking on the pages listed below, or by using the keyword search tool below to find specific information within the annual report.-
 1
1 -
2
-
3
-
4
-
5
-
6
-
7
-
8
-
9
-
10
-
11
-
12
-
13
-
14
-
15
-
16
-
17
-
18
-
19
-
20
-
21
-
22
-
23
-
24
-
25
-
26
-
27
-
28
-
29
-
30
-
31
-
32
-
33
-
34
-
35
-
36
-
37
-
38
-
39
-
40
-
41
-
42
-
43
-
44
-
45
-
46
-
47
-
48
-
49
-
50
-
51
-
52
-
53
-
54
-
55
-
56
-
57
-
58
-
59
-
60
-
61
-
62
-
63
-
64
-
65
-
66
-
67
-
68
-
69
-
70
-
71
-
72
-
73
-
74
-
75
-
76
-
77
-
78
-
79
-
80
-
81
-
82
-
83
-
84
-
85
-
86
-
87
-
88
-
89
-
90
-
91
-
92
-
93
-
94
-
95
-
96
-
97
-
98
-
99
-
100
-
101
-
102
-
103
-
104
-
105
-
106
-
107
-
108
-
109
-
110
-
111
-
112
-
113
-
114
-
115
-
116
-
117
-
118
-
119
-
120
-
121
-
122
-
123
-
124
-
125
-
126
-
127
-
128
-
129
-
130
-
131
-
132
-
133
-
134
-
135
-
136
-
137
-
138
-
139
-
140
-
141
-
142
-
143
-
144
-
145
-
146
-
147
-
148
-
149
-
150
-
151
-
152
-
153
-
154
-
155
-
156
-
157
-
158
-
159
-
160
-
161
-
162
-
163
-
164
-
165
-
166
-
167
-
168
-
169
-
170
-
171
-
172
-
173
-
174
-
175
-
176
-
177
-
178
-
179
-
180
-
181
-
182
-
183
-
184
-
185
-
186
-
187
-
188
-
189
-
190
-
191
-
192
-
193
-
194
-
195
-
196
-
197
-
198
-
199
-
200
-
201
-
202
-
203
-
204
-
205
-
206
-
207
-
208
-
209
-
210
-
211
-
212
-
213
-
214
-
215
-
216
-
217
-
218
-
219
-
220
-
221
-
222
-
223
-
224
-
225
-
226
-
227
-
228
-
229
-
230
-
231
-
232
-
233
-
234
-
235
-
236
-
237
-
238
-
239
-
240
-
 241
241 -
 242
242 -
 243
243 -
 244
244 -
 245
245 -
 246
246 -
 247
247 -
 248
248 -
 249
249 -
 250
250 -
 251
251 -
 252
252 -
 253
253 -
 254
254 -
 255
255 -
 256
256 -
 257
257 -
 258
258 -
 259
259 -
 260
260 -
 261
261 -
262
-
263
-
264
-
265
-
266
-
267
-
268
 |
 |

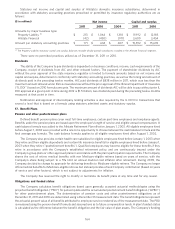
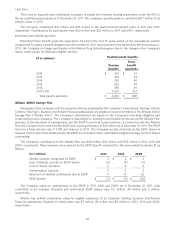
policy for the pension plans is to make annual contributions at a level that is in accordance with regulations under the
Internal Revenue Code (‘‘IRC’’) and generally accepted actuarial principles. The Company’s postretirement benefit plans
are not funded.
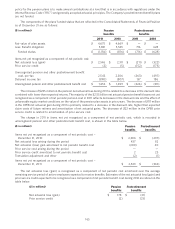
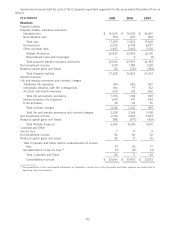
The components of the plans’ funded status that are reflected in the Consolidated Statements of Financial Position
as of December 31 are as follows:
($ in millions) Pension Postretirement
benefits benefits
2011 2010 2011 2010
Fair value of plan assets $ 4,675 $ 4,669 $ — $ —
Less: Benefit obligation 5,831 5,545 716 628
Funded status $ (1,156) $ (876) $ (716) $ (628)
Items not yet recognized as a component of net periodic cost:
Net actuarial loss (gain) $ 2,546 $ 2,311 $ (211) $ (322)
Prior service credit (3) (5) (152) (175)
Unrecognized pension and other postretirement benefit
cost, pre-tax 2,543 2,306 (363) (497)
Deferred income tax (890) (807) 137 186
Unrecognized pension and other postretirement benefit cost $ 1,653 $ 1,499 $ (226) $ (311)
The increase of $235 million in the pension net actuarial loss during 2011 is related to a decrease in the discount rate
combined with lower than expected returns. The majority of the $2.55 billion net actuarial pension benefit losses not yet
recognized as a component of net periodic pension cost in 2011 reflects decreases in the discount rate and the effect of
unfavorable equity market conditions on the value of the pension plan assets in prior years. The decrease of $111 million
in the OPEB net actuarial gain during 2011 is primarily related to a decrease in the discount rate, higher than expected
claim costs of future retirees and amortization of net actuarial gains. The decrease of $23 million in the OPEB prior
service credit is related to amortization of prior service cost.
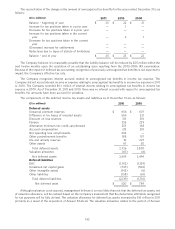
The change in 2011 in items not yet recognized as a component of net periodic cost, which is recorded in
unrecognized pension and other postretirement benefit cost, is shown in the table below.
($ in millions) Pension Postretirement
benefits benefits
Items not yet recognized as a component of net periodic cost –
December 31, 2010 $ 2,306 $ (497)
Net actuarial loss arising during the period 437 82
Net actuarial (loss) gain amortized to net periodic benefit cost (200) 30
Prior service cost arising during the period — —
Prior service credit amortized to net periodic benefit cost 2 23
Translation adjustment and other (2) (1)
Items not yet recognized as a component of net periodic cost –
December 31, 2011 $ 2,543 $ (363)
The net actuarial loss (gain) is recognized as a component of net periodic cost amortized over the average
remaining service period of active employees expected to receive benefits. Estimates of the net actuarial loss (gain) and
prior service credit expected to be recognized as a component of net periodic benefit cost during 2012 are shown in the
table below.
($ in millions) Pension Postretirement
benefits benefits
Net actuarial loss (gain) $ 178 $ (21)
Prior service credit (2) (23)
165