United Airlines 2012 Annual Report Download - page 99
Download and view the complete annual report
Please find page 99 of the 2012 United Airlines annual report below. You can navigate through the pages in the report by either clicking on the pages listed below, or by using the keyword search tool below to find specific information within the annual report.-
 1
1 -
2
-
3
-
4
-
5
-
6
-
7
-
8
-
9
-
10
-
11
-
12
-
13
-
14
-
15
-
16
-
17
-
18
-
19
-
20
-
21
-
22
-
23
-
24
-
25
-
26
-
27
-
28
-
29
-
30
-
31
-
32
-
33
-
34
-
35
-
36
-
37
-
38
-
39
-
40
-
41
-
42
-
43
-
44
-
45
-
46
-
47
-
48
-
49
-
50
-
51
-
52
-
53
-
54
-
55
-
56
-
57
-
58
-
59
-
60
-
61
-
62
-
63
-
64
-
65
-
66
-
67
-
68
-
69
-
70
-
71
-
72
-
73
-
74
-
75
-
76
-
77
-
78
-
79
-
80
-
81
-
82
-
83
-
84
-
85
-
86
-
87
-
88
-
 89
89 -
 90
90 -
 91
91 -
 92
92 -
 93
93 -
 94
94 -
 95
95 -
 96
96 -
 97
97 -
 98
98 -
 99
99 -
 100
100 -
 101
101 -
 102
102 -
 103
103 -
 104
104 -
 105
105 -
 106
106 -
 107
107 -
 108
108 -
 109
109 -
110
-
111
-
112
-
113
-
114
-
115
-
116
-
117
-
118
-
119
-
120
-
121
-
122
-
123
-
124
-
125
-
126
-
127
-
128
-
129
-
130
-
131
-
132
-
133
-
134
-
135
-
136
-
137
-
138
-
139
-
140
-
141
-
142
-
143
-
144
-
145
-
146
-
147
-
148
-
149
-
150
-
151
-
152
-
153
-
154
-
155
-
156
-
157
-
158
-
159
-
160
-
161
-
162
-
163
-
164
-
165
-
166
-
167
-
168
-
169
-
170
-
171
-
172
-
173
-
174
-
175
-
176
-
177
-
178
-
179
-
180
-
181
-
182
-
183
-
184
-
185
-
186
-
187
-
188
-
189
-
190
-
191
-
192
-
193
-
194
-
195
-
196
-
197
-
198
-
199
-
200
-
201
-
202
-
203
-
204
-
205
-
206
-
207
-
208
-
209
-
210
-
211
-
212
-
213
-
214
-
215
-
216
-
217
-
218
-
219
-
220
-
221
-
222
-
223
-
224
-
225
-
226
-
227
-
228
-
229
-
230
-
231
-
232
-
233
-
234
-
235
-
236
-
237
-
238
-
239
-
240
-
241
-
242
-
243
-
244
-
245
-
246
-
247
-
248
-
249
-
250
-
251
-
252
-
253
-
254
-
255
-
256
-
257
-
258
-
259
-
260
-
261
-
262
-
263
-
264
-
265
-
266
-
267
-
268
-
269
-
270
-
271
-
272
-
273
-
274
-
275
-
276
-
277
-
278
-
279
-
280
-
281
-
282
-
283
-
284
-
285
-
286
-
287
-
288
-
289
-
290
-
291
-
292
-
293
-
294
-
295
-
296
-
297
-
298
-
299
-
300
-
301
-
302
-
303
-
304
-
305
-
306
-
307
-
308
-
309
-
310
-
311
-
312
-
313
-
314
-
315
-
316
-
317
-
318
-
319
-
320
-
321
-
322
-
323
-
324
-
325
-
326
-
327
-
328
-
329
-
330
-
331
-
332
-
333
-
334
-
335
-
336
-
337
-
338
-
339
-
340
-
341
-
342
-
343
-
344
-
345
-
346
-
347
-
348
-
349
-
350
-
351
-
352
-
353
-
354
-
355
-
356
-
357
-
358
-
359
-
360
-
361
-
362
-
363
-
364
-
365
-
366
-
367
-
368
-
369
-
370
-
371
-
372
-
373
-
374
-
375
-
376
-
377
-
378
-
379
-
380
-
381
-
382
-
383
-
384
-
385
-
386
-
387
-
388
-
389
-
390
-
391
-
392
-
393
-
394
-
395
-
396
-
397
-
398
-
399
-
400
-
401
-
402
-
403
-
404
-
405
-
406
-
407
-
408
-
409
-
410
-
411
-
412
-
413
-
414
-
415
-
416
-
417
-
418
-
419
-
420
-
421
-
422
-
423
-
424
-
425
-
426
-
427
-
428
-
429
-
430
-
431
-
432
-
433
-
434
-
435
-
436
-
437
-
438
-
439
-
440
-
441
-
442
-
443
-
444
-
445
-
446
-
447
-
448
-
449
-
450
-
451
-
452
-
453
-
454
-
455
-
456
-
457
-
458
-
459
-
460
-
461
 |
 |

Table of Contents
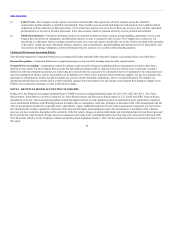
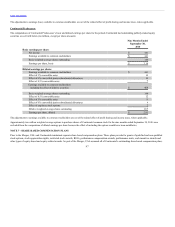
All awards are recorded as equity or a liability in UAL’s consolidated balance sheet. The share-based compensation expense specifically attributable to the
employees of United and Continental is directly recorded to salaries and related costs, or integration-related expense, within each of their respective statements
of operations. United and Continental record an allocation of share-based expense for employees that devote a significant amount of time to both companies. As
United and Continental do not sponsor their own share-based compensation plans, the disclosures below primarily relate to UAL. See the “Continental
Predecessor” section below, for share-based compensation disclosures applicable to Continental prior to the Merger.
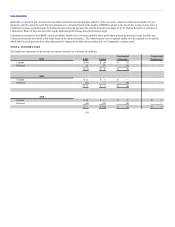
In February 2012, UAL granted share-based compensation awards pursuant to the United Continental Holdings, Inc. 2008 Incentive Compensation Plan.
These share-based compensation awards include approximately 0.5 million shares of restricted stock and 0.6 million of RSUs that vest pro-rata over three
years on the anniversary of the grant date. The time vested RSUs are cash-settled based on the 20-day average closing price of UAL common stock
immediately prior to the vesting date. In addition, UAL granted 1.3 million performance-based RSUs that will vest based on UAL’s return on invested capital
for the three years ending December 31, 2014. If this performance condition is achieved, cash payments will be made after the end of the performance period
based on the 20-day average closing price of UAL common stock immediately prior to the vesting date. The Company accounts for the RSUs as liability
awards.
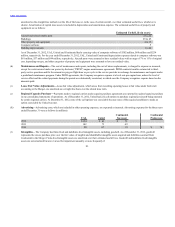
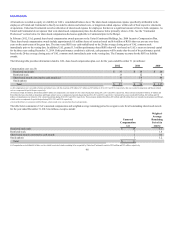
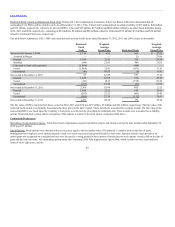
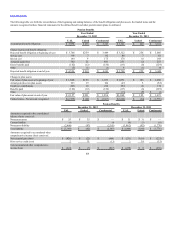
The following table provides information related to UAL share-based compensation plan cost, for the years ended December 31 (in millions):
Compensation cost: (a), (b)
Restricted stock units $ 37 $ 18 $ 20
Restricted stock 13 12 6
Share-based awards converted to cash awards (c) 6 19 84
Stock options 1 5 7
Total $ 57 $ 54 $ 117
(a) All compensation cost is recorded to Salaries and related costs, with the exception of $9 million, $17 million and $70 million in 2012, 2011 and 2010, respectively, that was recorded in integration and Merger-related
costs as a component of special charges, respectively.
(b) United recorded $32 million, $28 million and $63 million of compensation cost related to UAL’s share-based plans during 2012, 2011 and 2010, respectively. These amounts included $5 million, $7 million and
$24 million that were classified as integration and Merger-related costs as a component of special charges during 2012, 2011 and 2010, respectively. Continental Successor recorded $25 million, $26 million and $54
million of compensation cost related to UAL’s share-based plans during 2012, 2011 and 2010, respectively. These amounts included $4 million, $10 million and $46 million that were classified as integration and Merger-
related costs as a component of special charges during 2012, 2011 and 2010, respectively.
(c)As described below, in connection with the Merger, certain awards were converted into fixed cash equivalents.
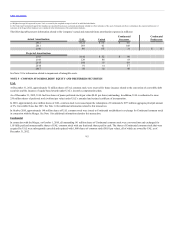
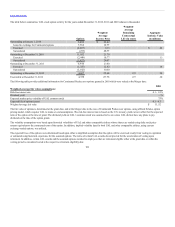
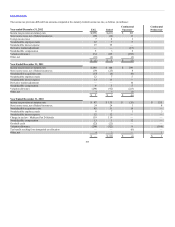
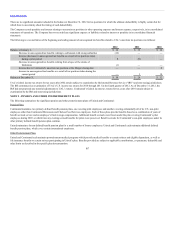
The table below summarizes UAL’s unearned compensation and weighted-average remaining period to recognize costs for all outstanding share-based awards
for the year ended December 31, 2012 (in millions, except as noted):
Restricted stock units $ 24 1.1
Restricted stock 7 1.4
Share-based awards converted to cash awards 1 0.2
Stock options 1 1.2
Total $ 33
(a) Compensation cost attributable to future service related to unvested awards remaining to be recognized by United and Continental consists of $18 million and $15 million, respectively.
98