United Airlines 2012 Annual Report Download - page 90
Download and view the complete annual report
Please find page 90 of the 2012 United Airlines annual report below. You can navigate through the pages in the report by either clicking on the pages listed below, or by using the keyword search tool below to find specific information within the annual report.-
 1
1 -
2
-
3
-
4
-
5
-
6
-
7
-
8
-
9
-
10
-
11
-
12
-
13
-
14
-
15
-
16
-
17
-
18
-
19
-
20
-
21
-
22
-
23
-
24
-
25
-
26
-
27
-
28
-
29
-
30
-
31
-
32
-
33
-
34
-
35
-
36
-
37
-
38
-
39
-
40
-
41
-
42
-
43
-
44
-
45
-
46
-
47
-
48
-
49
-
50
-
51
-
52
-
53
-
54
-
55
-
56
-
57
-
58
-
59
-
60
-
61
-
62
-
63
-
64
-
65
-
66
-
67
-
68
-
69
-
70
-
71
-
72
-
73
-
74
-
75
-
76
-
77
-
78
-
79
-
 80
80 -
 81
81 -
 82
82 -
 83
83 -
 84
84 -
 85
85 -
 86
86 -
 87
87 -
 88
88 -
 89
89 -
 90
90 -
 91
91 -
 92
92 -
 93
93 -
 94
94 -
 95
95 -
 96
96 -
 97
97 -
 98
98 -
 99
99 -
 100
100 -
101
-
102
-
103
-
104
-
105
-
106
-
107
-
108
-
109
-
110
-
111
-
112
-
113
-
114
-
115
-
116
-
117
-
118
-
119
-
120
-
121
-
122
-
123
-
124
-
125
-
126
-
127
-
128
-
129
-
130
-
131
-
132
-
133
-
134
-
135
-
136
-
137
-
138
-
139
-
140
-
141
-
142
-
143
-
144
-
145
-
146
-
147
-
148
-
149
-
150
-
151
-
152
-
153
-
154
-
155
-
156
-
157
-
158
-
159
-
160
-
161
-
162
-
163
-
164
-
165
-
166
-
167
-
168
-
169
-
170
-
171
-
172
-
173
-
174
-
175
-
176
-
177
-
178
-
179
-
180
-
181
-
182
-
183
-
184
-
185
-
186
-
187
-
188
-
189
-
190
-
191
-
192
-
193
-
194
-
195
-
196
-
197
-
198
-
199
-
200
-
201
-
202
-
203
-
204
-
205
-
206
-
207
-
208
-
209
-
210
-
211
-
212
-
213
-
214
-
215
-
216
-
217
-
218
-
219
-
220
-
221
-
222
-
223
-
224
-
225
-
226
-
227
-
228
-
229
-
230
-
231
-
232
-
233
-
234
-
235
-
236
-
237
-
238
-
239
-
240
-
241
-
242
-
243
-
244
-
245
-
246
-
247
-
248
-
249
-
250
-
251
-
252
-
253
-
254
-
255
-
256
-
257
-
258
-
259
-
260
-
261
-
262
-
263
-
264
-
265
-
266
-
267
-
268
-
269
-
270
-
271
-
272
-
273
-
274
-
275
-
276
-
277
-
278
-
279
-
280
-
281
-
282
-
283
-
284
-
285
-
286
-
287
-
288
-
289
-
290
-
291
-
292
-
293
-
294
-
295
-
296
-
297
-
298
-
299
-
300
-
301
-
302
-
303
-
304
-
305
-
306
-
307
-
308
-
309
-
310
-
311
-
312
-
313
-
314
-
315
-
316
-
317
-
318
-
319
-
320
-
321
-
322
-
323
-
324
-
325
-
326
-
327
-
328
-
329
-
330
-
331
-
332
-
333
-
334
-
335
-
336
-
337
-
338
-
339
-
340
-
341
-
342
-
343
-
344
-
345
-
346
-
347
-
348
-
349
-
350
-
351
-
352
-
353
-
354
-
355
-
356
-
357
-
358
-
359
-
360
-
361
-
362
-
363
-
364
-
365
-
366
-
367
-
368
-
369
-
370
-
371
-
372
-
373
-
374
-
375
-
376
-
377
-
378
-
379
-
380
-
381
-
382
-
383
-
384
-
385
-
386
-
387
-
388
-
389
-
390
-
391
-
392
-
393
-
394
-
395
-
396
-
397
-
398
-
399
-
400
-
401
-
402
-
403
-
404
-
405
-
406
-
407
-
408
-
409
-
410
-
411
-
412
-
413
-
414
-
415
-
416
-
417
-
418
-
419
-
420
-
421
-
422
-
423
-
424
-
425
-
426
-
427
-
428
-
429
-
430
-
431
-
432
-
433
-
434
-
435
-
436
-
437
-
438
-
439
-
440
-
441
-
442
-
443
-
444
-
445
-
446
-
447
-
448
-
449
-
450
-
451
-
452
-
453
-
454
-
455
-
456
-
457
-
458
-
459
-
460
-
461
 |
 |

Table of Contents
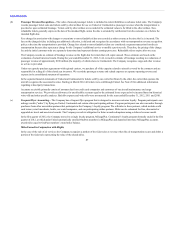
We applied this transition provision by revaluing the undelivered air transportation element using its new estimated selling price as determined in
connection with the contract modification. This estimated selling price was lower than the rate at which the undelivered element had been deferred
under the previous co-branded credit card contracts, and as a result, we recorded a one-time non-cash adjustment to decrease frequent flyer deferred
revenue and increase special revenues by $107 million in June 2011, which is included in the table below under Accounting Policy Changes.
The Company records passenger revenue related to the air transportation element when the transportation is delivered. The other elements are
generally recognized as other operating revenue when earned.
Prior to 2011, the Company had two primary revenue elements, marketing and air transportation, using an equivalent ticket value to determine the
fair value of miles, and applying a residual accounting methodology to allocate the arrangement consideration.
United accounts for miles sold and awarded that will never be redeemed by program members, which we refer to as “breakage,” using the
redemption method. UAL reviews its breakage estimates annually based upon the latest available information regarding redemption and expiration
patterns. The Company re-evaluated its population breakage estimates for a portion of its miles, which were previously not subject to an expiration
policy, and increased the estimate of miles in the population expected to ultimately expire.
The Company’s estimate of the expected expiration of miles requires significant management judgment. Current and future changes to expiration
assumptions or to the expiration policy, or to program rules and program redemption opportunities, may result in material changes to the deferred
revenue balance as well as recognized revenues from the programs.
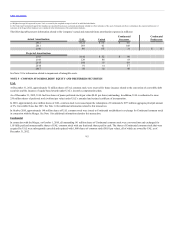
The application of ASU 2009-13 in 2011 to passenger ticket transactions and the Chase co-branded credit card relationship (including the special
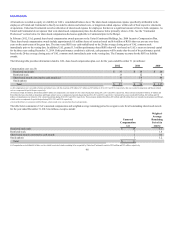
revenue item) resulted in the following estimated increases to revenue in the year of adoption (in millions, except per share amounts):
Operating revenue (including special revenue item) $ 600 $395 $ 205
Per basic share 1.82 NM NM
Per diluted share 1.57 NM NM
The annual impact of adopting ASU 2009-13 on operating revenue will decrease over time. Our ability to project the annual decline for each year is
significantly impacted by credit card sales volumes, frequent flyer redemption patterns, and other factors, including the 2012 changes in breakage
from the application of the 18 month expiration policy to certain miles and the change in estimated selling price for flight miles, all of which are
described above. As a result, the impact of the accounting change in 2012 and future periods cannot be objectively determined.
89