United Airlines 2012 Annual Report Download - page 44
Download and view the complete annual report
Please find page 44 of the 2012 United Airlines annual report below. You can navigate through the pages in the report by either clicking on the pages listed below, or by using the keyword search tool below to find specific information within the annual report.-
 1
1 -
2
-
3
-
4
-
5
-
6
-
7
-
8
-
9
-
10
-
11
-
12
-
13
-
14
-
15
-
16
-
17
-
18
-
19
-
20
-
21
-
22
-
23
-
24
-
25
-
26
-
27
-
28
-
29
-
30
-
31
-
32
-
33
-
 34
34 -
 35
35 -
 36
36 -
 37
37 -
 38
38 -
 39
39 -
 40
40 -
 41
41 -
 42
42 -
 43
43 -
 44
44 -
 45
45 -
 46
46 -
 47
47 -
 48
48 -
 49
49 -
 50
50 -
 51
51 -
 52
52 -
 53
53 -
 54
54 -
55
-
56
-
57
-
58
-
59
-
60
-
61
-
62
-
63
-
64
-
65
-
66
-
67
-
68
-
69
-
70
-
71
-
72
-
73
-
74
-
75
-
76
-
77
-
78
-
79
-
80
-
81
-
82
-
83
-
84
-
85
-
86
-
87
-
88
-
89
-
90
-
91
-
92
-
93
-
94
-
95
-
96
-
97
-
98
-
99
-
100
-
101
-
102
-
103
-
104
-
105
-
106
-
107
-
108
-
109
-
110
-
111
-
112
-
113
-
114
-
115
-
116
-
117
-
118
-
119
-
120
-
121
-
122
-
123
-
124
-
125
-
126
-
127
-
128
-
129
-
130
-
131
-
132
-
133
-
134
-
135
-
136
-
137
-
138
-
139
-
140
-
141
-
142
-
143
-
144
-
145
-
146
-
147
-
148
-
149
-
150
-
151
-
152
-
153
-
154
-
155
-
156
-
157
-
158
-
159
-
160
-
161
-
162
-
163
-
164
-
165
-
166
-
167
-
168
-
169
-
170
-
171
-
172
-
173
-
174
-
175
-
176
-
177
-
178
-
179
-
180
-
181
-
182
-
183
-
184
-
185
-
186
-
187
-
188
-
189
-
190
-
191
-
192
-
193
-
194
-
195
-
196
-
197
-
198
-
199
-
200
-
201
-
202
-
203
-
204
-
205
-
206
-
207
-
208
-
209
-
210
-
211
-
212
-
213
-
214
-
215
-
216
-
217
-
218
-
219
-
220
-
221
-
222
-
223
-
224
-
225
-
226
-
227
-
228
-
229
-
230
-
231
-
232
-
233
-
234
-
235
-
236
-
237
-
238
-
239
-
240
-
241
-
242
-
243
-
244
-
245
-
246
-
247
-
248
-
249
-
250
-
251
-
252
-
253
-
254
-
255
-
256
-
257
-
258
-
259
-
260
-
261
-
262
-
263
-
264
-
265
-
266
-
267
-
268
-
269
-
270
-
271
-
272
-
273
-
274
-
275
-
276
-
277
-
278
-
279
-
280
-
281
-
282
-
283
-
284
-
285
-
286
-
287
-
288
-
289
-
290
-
291
-
292
-
293
-
294
-
295
-
296
-
297
-
298
-
299
-
300
-
301
-
302
-
303
-
304
-
305
-
306
-
307
-
308
-
309
-
310
-
311
-
312
-
313
-
314
-
315
-
316
-
317
-
318
-
319
-
320
-
321
-
322
-
323
-
324
-
325
-
326
-
327
-
328
-
329
-
330
-
331
-
332
-
333
-
334
-
335
-
336
-
337
-
338
-
339
-
340
-
341
-
342
-
343
-
344
-
345
-
346
-
347
-
348
-
349
-
350
-
351
-
352
-
353
-
354
-
355
-
356
-
357
-
358
-
359
-
360
-
361
-
362
-
363
-
364
-
365
-
366
-
367
-
368
-
369
-
370
-
371
-
372
-
373
-
374
-
375
-
376
-
377
-
378
-
379
-
380
-
381
-
382
-
383
-
384
-
385
-
386
-
387
-
388
-
389
-
390
-
391
-
392
-
393
-
394
-
395
-
396
-
397
-
398
-
399
-
400
-
401
-
402
-
403
-
404
-
405
-
406
-
407
-
408
-
409
-
410
-
411
-
412
-
413
-
414
-
415
-
416
-
417
-
418
-
419
-
420
-
421
-
422
-
423
-
424
-
425
-
426
-
427
-
428
-
429
-
430
-
431
-
432
-
433
-
434
-
435
-
436
-
437
-
438
-
439
-
440
-
441
-
442
-
443
-
444
-
445
-
446
-
447
-
448
-
449
-
450
-
451
-
452
-
453
-
454
-
455
-
456
-
457
-
458
-
459
-
460
-
461
 |
 |

Table of Contents
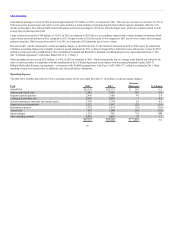
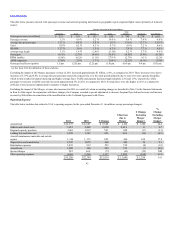
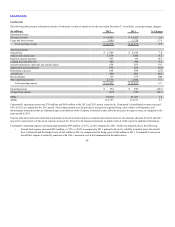
Excluding the impact of the Merger, operating expenses increased approximately $1.3 billion, or 6.9%, in 2011 as compared to 2010.
The significant increase in aircraft fuel expense was primarily attributable to a 27% increase in fuel prices offset by a 2.2% decrease in fuel consumption.
Salaries and related costs increased $31 million, or 0.7%, due to higher pay rates and a one-time signing bonus for certain labor groups.
Landing fees and other rent decreased $48 million, or 4.5%, primarily due to higher than anticipated credits (refunds) received in 2011 as a result of airports’
audits of prior period payment.
Aircraft maintenance materials and outside repairs increased $169 million, or 17.2%, primarily due to increased power by the hour rates and a higher
number of service events.
Other operating expenses decreased $168 million, or 6.2%, primarily due to aircraft redeployment as a result of the Merger.
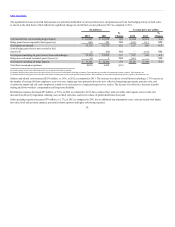
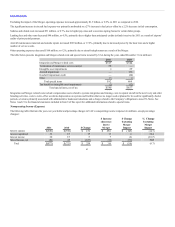
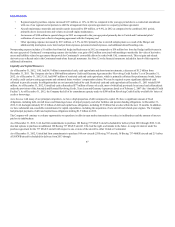
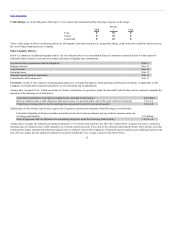
The table below presents integration and Merger-related costs and special items incurred by UAL during the years ended December 31 (in millions):
Integration and Merger-related costs $517 $564
Termination of maintenance service contract 58 —
Intangible asset impairments 4 29
Aircraft impairment — 136
Goodwill impairment credit — (64)
Other 13 4
Total special items 592 669
Tax benefit on intangible asset impairments (2) (12)
Total special items, net of tax $590 $657
Integration and Merger-related costs include compensation costs related to systems integration and training, costs to repaint aircraft in the new livery and other
branding activities, costs to write-off or accelerate depreciation on systems and facilities that are no longer used or planned to be used for significantly shorter
periods, severance primarily associated with administrative headcount reductions and a charge related to the Company’s obligation to issue 8% Notes. See
Notes 1 and 21 to the financial statements included in Item 8 of this report for additional information related to special items.
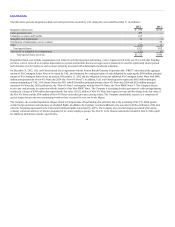
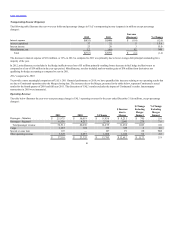
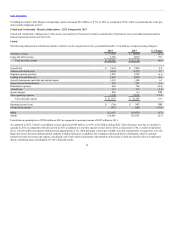
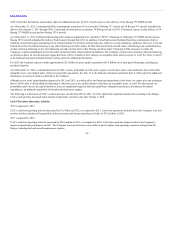
Nonoperating Income (Expense)
The following table illustrates the year-over-year dollar and percentage changes in UAL’s nonoperating income (expense) (in millions, except percentage
changes):
Interest expense $(949) $(798) $ 151 $ 256 $(105) (14.7)
Interest capitalized 32 15 17 13 4 36.4
Interest income 20 15 5 7 (2) (16.7)
Miscellaneous, net (80) 45 (125) (74) (51) NM
Total $(977) $(723) $ 254 $ 310 $ (56) (8.7)
43