United Airlines 2012 Annual Report Download - page 45
Download and view the complete annual report
Please find page 45 of the 2012 United Airlines annual report below. You can navigate through the pages in the report by either clicking on the pages listed below, or by using the keyword search tool below to find specific information within the annual report.-
 1
1 -
2
-
3
-
4
-
5
-
6
-
7
-
8
-
9
-
10
-
11
-
12
-
13
-
14
-
15
-
16
-
17
-
18
-
19
-
20
-
21
-
22
-
23
-
24
-
25
-
26
-
27
-
28
-
29
-
30
-
31
-
32
-
33
-
34
-
 35
35 -
 36
36 -
 37
37 -
 38
38 -
 39
39 -
 40
40 -
 41
41 -
 42
42 -
 43
43 -
 44
44 -
 45
45 -
 46
46 -
 47
47 -
 48
48 -
 49
49 -
 50
50 -
 51
51 -
 52
52 -
 53
53 -
 54
54 -
 55
55 -
56
-
57
-
58
-
59
-
60
-
61
-
62
-
63
-
64
-
65
-
66
-
67
-
68
-
69
-
70
-
71
-
72
-
73
-
74
-
75
-
76
-
77
-
78
-
79
-
80
-
81
-
82
-
83
-
84
-
85
-
86
-
87
-
88
-
89
-
90
-
91
-
92
-
93
-
94
-
95
-
96
-
97
-
98
-
99
-
100
-
101
-
102
-
103
-
104
-
105
-
106
-
107
-
108
-
109
-
110
-
111
-
112
-
113
-
114
-
115
-
116
-
117
-
118
-
119
-
120
-
121
-
122
-
123
-
124
-
125
-
126
-
127
-
128
-
129
-
130
-
131
-
132
-
133
-
134
-
135
-
136
-
137
-
138
-
139
-
140
-
141
-
142
-
143
-
144
-
145
-
146
-
147
-
148
-
149
-
150
-
151
-
152
-
153
-
154
-
155
-
156
-
157
-
158
-
159
-
160
-
161
-
162
-
163
-
164
-
165
-
166
-
167
-
168
-
169
-
170
-
171
-
172
-
173
-
174
-
175
-
176
-
177
-
178
-
179
-
180
-
181
-
182
-
183
-
184
-
185
-
186
-
187
-
188
-
189
-
190
-
191
-
192
-
193
-
194
-
195
-
196
-
197
-
198
-
199
-
200
-
201
-
202
-
203
-
204
-
205
-
206
-
207
-
208
-
209
-
210
-
211
-
212
-
213
-
214
-
215
-
216
-
217
-
218
-
219
-
220
-
221
-
222
-
223
-
224
-
225
-
226
-
227
-
228
-
229
-
230
-
231
-
232
-
233
-
234
-
235
-
236
-
237
-
238
-
239
-
240
-
241
-
242
-
243
-
244
-
245
-
246
-
247
-
248
-
249
-
250
-
251
-
252
-
253
-
254
-
255
-
256
-
257
-
258
-
259
-
260
-
261
-
262
-
263
-
264
-
265
-
266
-
267
-
268
-
269
-
270
-
271
-
272
-
273
-
274
-
275
-
276
-
277
-
278
-
279
-
280
-
281
-
282
-
283
-
284
-
285
-
286
-
287
-
288
-
289
-
290
-
291
-
292
-
293
-
294
-
295
-
296
-
297
-
298
-
299
-
300
-
301
-
302
-
303
-
304
-
305
-
306
-
307
-
308
-
309
-
310
-
311
-
312
-
313
-
314
-
315
-
316
-
317
-
318
-
319
-
320
-
321
-
322
-
323
-
324
-
325
-
326
-
327
-
328
-
329
-
330
-
331
-
332
-
333
-
334
-
335
-
336
-
337
-
338
-
339
-
340
-
341
-
342
-
343
-
344
-
345
-
346
-
347
-
348
-
349
-
350
-
351
-
352
-
353
-
354
-
355
-
356
-
357
-
358
-
359
-
360
-
361
-
362
-
363
-
364
-
365
-
366
-
367
-
368
-
369
-
370
-
371
-
372
-
373
-
374
-
375
-
376
-
377
-
378
-
379
-
380
-
381
-
382
-
383
-
384
-
385
-
386
-
387
-
388
-
389
-
390
-
391
-
392
-
393
-
394
-
395
-
396
-
397
-
398
-
399
-
400
-
401
-
402
-
403
-
404
-
405
-
406
-
407
-
408
-
409
-
410
-
411
-
412
-
413
-
414
-
415
-
416
-
417
-
418
-
419
-
420
-
421
-
422
-
423
-
424
-
425
-
426
-
427
-
428
-
429
-
430
-
431
-
432
-
433
-
434
-
435
-
436
-
437
-
438
-
439
-
440
-
441
-
442
-
443
-
444
-
445
-
446
-
447
-
448
-
449
-
450
-
451
-
452
-
453
-
454
-
455
-
456
-
457
-
458
-
459
-
460
-
461
 |
 |

Table of Contents
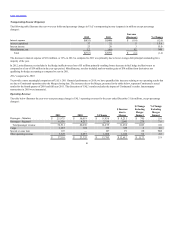
Excluding the impact of the Merger, nonoperating expense decreased $56 million, or 8.7%, in 2011 as compared to 2010, which was primarily due to the pay
down of debt obligations in 2011.
United and Continental - Results of Operations - 2012 Compared to 2011
United and Continental’s have been abbreviated pursuant to
General Instructions I(2)(a) of Form 10-K.
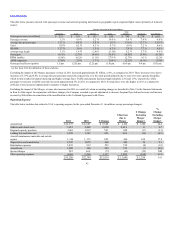
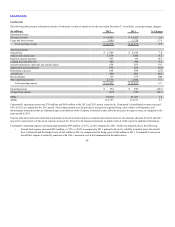
United
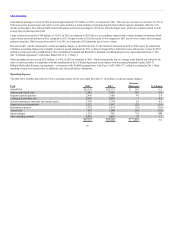
The following table presents information related to United’s results of operations for the year ended December 31 (in millions, except percentage changes):
Passenger revenue $ 17,592 $ 18,088 (2.7)
Cargo and other revenue 3,369 3,067 9.8
Total operating revenue $ 20,961 $ 21,155 (0.9)
Aircraft fuel $ 7,430 $ 7,080 4.9
Salaries and related costs 4,234 4,172 1.5
Regional capacity purchase 1,507 1,574 (4.3)
Landing fees and other rent 1,030 1,028 0.2
Aircraft maintenance materials and outside repairs 1,163 1,160 0.3
Depreciation and amortization 930 921 1.0
Distribution expenses 684 748 (8.6)
Aircraft rent 313 323 (3.1)
Special charges 984 433 NM
Other operating expenses 3,390 2,829 19.8
Total operating expense $ 21,665 $ 20,268 6.9
Operating income (loss) $ (704) $ 887 NM
Nonoperating expense (475) (603) (21.2)
RPMs 112,955 116,078 (2.7)
ASMs 136,063 139,815 (2.7)
United had an operating loss of $704 million in 2012 as compared to operating income of $887 million in 2011.
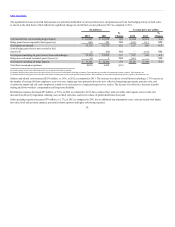
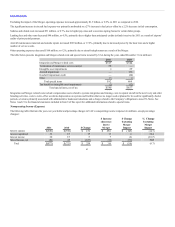
As compared to 2011, United’s consolidated revenue decreased $194 million, or 0.9%, to $21 billion during 2012. These decreases were due to a decline in
capacity in 2012 as compared to the same period in 2011 in addition to a one-time special revenue item in 2011, as discussed in UAL’s results of operations
above. United’s traffic and capacity both decreased approximately 2.7%, while passenger revenue per available seat mile remained flat. Average fares were also
higher due to fare increases implemented in response to higher fuel prices. In addition, the Company sold aircraft fuel to a third party, which is earnings-
neutral but results in revenue and expense, specifically cost of sale which is unrelated to the operation of the airline. United also had fuel sales to Continental
that are eliminated upon consolidation of UAL’s financial results.
44