United Airlines 2012 Annual Report Download - page 43
Download and view the complete annual report
Please find page 43 of the 2012 United Airlines annual report below. You can navigate through the pages in the report by either clicking on the pages listed below, or by using the keyword search tool below to find specific information within the annual report.-
 1
1 -
2
-
3
-
4
-
5
-
6
-
7
-
8
-
9
-
10
-
11
-
12
-
13
-
14
-
15
-
16
-
17
-
18
-
19
-
20
-
21
-
22
-
23
-
24
-
25
-
26
-
27
-
28
-
29
-
30
-
31
-
32
-
 33
33 -
 34
34 -
 35
35 -
 36
36 -
 37
37 -
 38
38 -
 39
39 -
 40
40 -
 41
41 -
 42
42 -
 43
43 -
 44
44 -
 45
45 -
 46
46 -
 47
47 -
 48
48 -
 49
49 -
 50
50 -
 51
51 -
 52
52 -
 53
53 -
54
-
55
-
56
-
57
-
58
-
59
-
60
-
61
-
62
-
63
-
64
-
65
-
66
-
67
-
68
-
69
-
70
-
71
-
72
-
73
-
74
-
75
-
76
-
77
-
78
-
79
-
80
-
81
-
82
-
83
-
84
-
85
-
86
-
87
-
88
-
89
-
90
-
91
-
92
-
93
-
94
-
95
-
96
-
97
-
98
-
99
-
100
-
101
-
102
-
103
-
104
-
105
-
106
-
107
-
108
-
109
-
110
-
111
-
112
-
113
-
114
-
115
-
116
-
117
-
118
-
119
-
120
-
121
-
122
-
123
-
124
-
125
-
126
-
127
-
128
-
129
-
130
-
131
-
132
-
133
-
134
-
135
-
136
-
137
-
138
-
139
-
140
-
141
-
142
-
143
-
144
-
145
-
146
-
147
-
148
-
149
-
150
-
151
-
152
-
153
-
154
-
155
-
156
-
157
-
158
-
159
-
160
-
161
-
162
-
163
-
164
-
165
-
166
-
167
-
168
-
169
-
170
-
171
-
172
-
173
-
174
-
175
-
176
-
177
-
178
-
179
-
180
-
181
-
182
-
183
-
184
-
185
-
186
-
187
-
188
-
189
-
190
-
191
-
192
-
193
-
194
-
195
-
196
-
197
-
198
-
199
-
200
-
201
-
202
-
203
-
204
-
205
-
206
-
207
-
208
-
209
-
210
-
211
-
212
-
213
-
214
-
215
-
216
-
217
-
218
-
219
-
220
-
221
-
222
-
223
-
224
-
225
-
226
-
227
-
228
-
229
-
230
-
231
-
232
-
233
-
234
-
235
-
236
-
237
-
238
-
239
-
240
-
241
-
242
-
243
-
244
-
245
-
246
-
247
-
248
-
249
-
250
-
251
-
252
-
253
-
254
-
255
-
256
-
257
-
258
-
259
-
260
-
261
-
262
-
263
-
264
-
265
-
266
-
267
-
268
-
269
-
270
-
271
-
272
-
273
-
274
-
275
-
276
-
277
-
278
-
279
-
280
-
281
-
282
-
283
-
284
-
285
-
286
-
287
-
288
-
289
-
290
-
291
-
292
-
293
-
294
-
295
-
296
-
297
-
298
-
299
-
300
-
301
-
302
-
303
-
304
-
305
-
306
-
307
-
308
-
309
-
310
-
311
-
312
-
313
-
314
-
315
-
316
-
317
-
318
-
319
-
320
-
321
-
322
-
323
-
324
-
325
-
326
-
327
-
328
-
329
-
330
-
331
-
332
-
333
-
334
-
335
-
336
-
337
-
338
-
339
-
340
-
341
-
342
-
343
-
344
-
345
-
346
-
347
-
348
-
349
-
350
-
351
-
352
-
353
-
354
-
355
-
356
-
357
-
358
-
359
-
360
-
361
-
362
-
363
-
364
-
365
-
366
-
367
-
368
-
369
-
370
-
371
-
372
-
373
-
374
-
375
-
376
-
377
-
378
-
379
-
380
-
381
-
382
-
383
-
384
-
385
-
386
-
387
-
388
-
389
-
390
-
391
-
392
-
393
-
394
-
395
-
396
-
397
-
398
-
399
-
400
-
401
-
402
-
403
-
404
-
405
-
406
-
407
-
408
-
409
-
410
-
411
-
412
-
413
-
414
-
415
-
416
-
417
-
418
-
419
-
420
-
421
-
422
-
423
-
424
-
425
-
426
-
427
-
428
-
429
-
430
-
431
-
432
-
433
-
434
-
435
-
436
-
437
-
438
-
439
-
440
-
441
-
442
-
443
-
444
-
445
-
446
-
447
-
448
-
449
-
450
-
451
-
452
-
453
-
454
-
455
-
456
-
457
-
458
-
459
-
460
-
461
 |
 |

Table of Contents
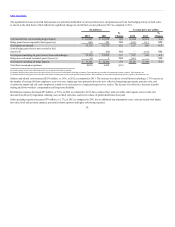
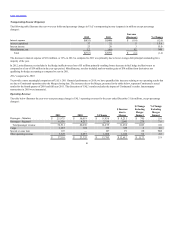
The table below presents selected UAL passenger revenue and selected operating data based on geographic region (regional flights consist primarily of domestic
routes):
Passenger revenue (in millions) $ 231 $ 183 $ 143 $ 188 $ 745 $ 278 $ 1,023
Passenger revenue 3.2 % 6.0 % 5.2 % 39.0 % 5.6 % 7.6 % 6.0 %
Average fare per passenger 13.1 % 8.9 % 5.8 % 1.6 % 13.0 % 13.7 % 12.9 %
Yield 9.8 % 6.2 % 6.3 % 8.7 % 8.4 % 7.2 % 8.4 %
PRASM 11.7 % 3.0 % 3.5 % 6.3 % 7.9 % 7.7 % 8.0 %
Average stage length 3.1 % 1.6 % (2.4)% (5.1)% 5.2 % 5.7 % 4.9 %
Passengers (8.7)% (2.7)% (0.6)% 36.8 % (6.5)% (5.4)% (6.1)%
RPMs (traffic) (6.0)% (0.2)% (1.1)% 27.9 % (2.7)% 0.3 % (2.2)%
ASMs (capacity) (7.6)% 2.8 % 1.7 % 30.8 % (2.2)% (0.1)% (1.9)%
Passenger load factor (points) 1.5 pts. (2.5) pts. (2.2) pts. (1.8) pts. (0.4) pts. 0.4 pts. (0.3) pts.
(a) See Item 6 for the definition of these statistics.
Excluding the impact of the Merger, passenger revenue in 2011 increased approximately $1 billion, or 6%, as compared to 2010. These increases were due to
increases of 12.9% and 8.4% in average fare per passenger and yield, respectively, over the same period primarily due to year-over-year capacity discipline,
which in turn resulted in improved pricing and higher average fares. Traffic and capacity decreased approximately 2.2% and 1.9%, respectively, while
passenger revenue per available seat mile increased approximately 8% in 2011 as compared to 2010. Average fares were also higher in 2011 as compared to
2010 due to fare increases implemented in response to higher fuel prices.
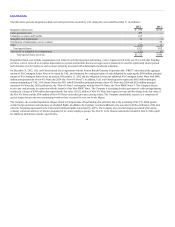
Excluding the impact of the Merger, revenue also increased in 2011 as a result of certain accounting changes as described in Note 2 to the financial statements
in Item 8 of this report. In conjunction with these changes, the Company recorded a special adjustment to decrease frequent flyer deferred revenue and increase
revenue by $88 million in connection with a modification to the Co-Brand Agreement with Chase.
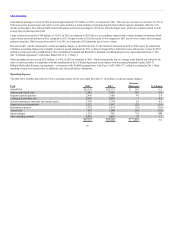
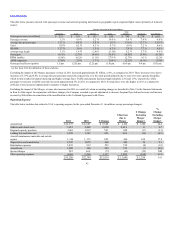
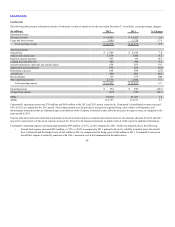
Operating Expense
The table below includes data related to UAL’s operating expense for the year ended December 31 (in millions, except percentage changes):
Aircraft fuel $12,375 $ 6,687 $ 5,688 $ 4,308 $ 1,380 24.2
Salaries and related costs 7,652 5,002 2,650 2,619 31 0.7
Regional capacity purchase 2,403 1,812 591 628 (37) (2.3)
Landing fees and other rent 1,928 1,307 621 669 (48) (4.5)
Aircraft maintenance materials and outside
repairs 1,744 1,115 629 460 169 17.2
Depreciation and amortization 1,547 1,079 468 449 19 2.1
Distribution expenses 1,435 912 523 532 (9) (1.2)
Aircraft rent 1,009 500 509 512 (3) (0.9)
Special charges 592 669 (77) (42) (35) NM
Other operating expenses 4,603 3,266 1,337 1,505 (168) (6.2)
$35,288 $22,349 $12,939 $ 11,640 $ 1,299 6.9
42