United Airlines 2012 Annual Report Download - page 106
Download and view the complete annual report
Please find page 106 of the 2012 United Airlines annual report below. You can navigate through the pages in the report by either clicking on the pages listed below, or by using the keyword search tool below to find specific information within the annual report.-
 1
1 -
2
-
3
-
4
-
5
-
6
-
7
-
8
-
9
-
10
-
11
-
12
-
13
-
14
-
15
-
16
-
17
-
18
-
19
-
20
-
21
-
22
-
23
-
24
-
25
-
26
-
27
-
28
-
29
-
30
-
31
-
32
-
33
-
34
-
35
-
36
-
37
-
38
-
39
-
40
-
41
-
42
-
43
-
44
-
45
-
46
-
47
-
48
-
49
-
50
-
51
-
52
-
53
-
54
-
55
-
56
-
57
-
58
-
59
-
60
-
61
-
62
-
63
-
64
-
65
-
66
-
67
-
68
-
69
-
70
-
71
-
72
-
73
-
74
-
75
-
76
-
77
-
78
-
79
-
80
-
81
-
82
-
83
-
84
-
85
-
86
-
87
-
88
-
89
-
90
-
91
-
92
-
93
-
94
-
95
-
 96
96 -
 97
97 -
 98
98 -
 99
99 -
 100
100 -
 101
101 -
 102
102 -
 103
103 -
 104
104 -
 105
105 -
 106
106 -
 107
107 -
 108
108 -
 109
109 -
 110
110 -
 111
111 -
 112
112 -
 113
113 -
 114
114 -
 115
115 -
 116
116 -
117
-
118
-
119
-
120
-
121
-
122
-
123
-
124
-
125
-
126
-
127
-
128
-
129
-
130
-
131
-
132
-
133
-
134
-
135
-
136
-
137
-
138
-
139
-
140
-
141
-
142
-
143
-
144
-
145
-
146
-
147
-
148
-
149
-
150
-
151
-
152
-
153
-
154
-
155
-
156
-
157
-
158
-
159
-
160
-
161
-
162
-
163
-
164
-
165
-
166
-
167
-
168
-
169
-
170
-
171
-
172
-
173
-
174
-
175
-
176
-
177
-
178
-
179
-
180
-
181
-
182
-
183
-
184
-
185
-
186
-
187
-
188
-
189
-
190
-
191
-
192
-
193
-
194
-
195
-
196
-
197
-
198
-
199
-
200
-
201
-
202
-
203
-
204
-
205
-
206
-
207
-
208
-
209
-
210
-
211
-
212
-
213
-
214
-
215
-
216
-
217
-
218
-
219
-
220
-
221
-
222
-
223
-
224
-
225
-
226
-
227
-
228
-
229
-
230
-
231
-
232
-
233
-
234
-
235
-
236
-
237
-
238
-
239
-
240
-
241
-
242
-
243
-
244
-
245
-
246
-
247
-
248
-
249
-
250
-
251
-
252
-
253
-
254
-
255
-
256
-
257
-
258
-
259
-
260
-
261
-
262
-
263
-
264
-
265
-
266
-
267
-
268
-
269
-
270
-
271
-
272
-
273
-
274
-
275
-
276
-
277
-
278
-
279
-
280
-
281
-
282
-
283
-
284
-
285
-
286
-
287
-
288
-
289
-
290
-
291
-
292
-
293
-
294
-
295
-
296
-
297
-
298
-
299
-
300
-
301
-
302
-
303
-
304
-
305
-
306
-
307
-
308
-
309
-
310
-
311
-
312
-
313
-
314
-
315
-
316
-
317
-
318
-
319
-
320
-
321
-
322
-
323
-
324
-
325
-
326
-
327
-
328
-
329
-
330
-
331
-
332
-
333
-
334
-
335
-
336
-
337
-
338
-
339
-
340
-
341
-
342
-
343
-
344
-
345
-
346
-
347
-
348
-
349
-
350
-
351
-
352
-
353
-
354
-
355
-
356
-
357
-
358
-
359
-
360
-
361
-
362
-
363
-
364
-
365
-
366
-
367
-
368
-
369
-
370
-
371
-
372
-
373
-
374
-
375
-
376
-
377
-
378
-
379
-
380
-
381
-
382
-
383
-
384
-
385
-
386
-
387
-
388
-
389
-
390
-
391
-
392
-
393
-
394
-
395
-
396
-
397
-
398
-
399
-
400
-
401
-
402
-
403
-
404
-
405
-
406
-
407
-
408
-
409
-
410
-
411
-
412
-
413
-
414
-
415
-
416
-
417
-
418
-
419
-
420
-
421
-
422
-
423
-
424
-
425
-
426
-
427
-
428
-
429
-
430
-
431
-
432
-
433
-
434
-
435
-
436
-
437
-
438
-
439
-
440
-
441
-
442
-
443
-
444
-
445
-
446
-
447
-
448
-
449
-
450
-
451
-
452
-
453
-
454
-
455
-
456
-
457
-
458
-
459
-
460
-
461
 |
 |

Table of Contents
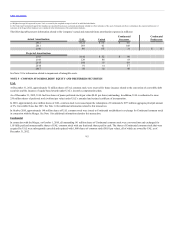
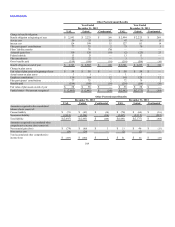
State tax benefit recorded in 2011 resulted from certain adjustments to existing state tax net operating losses, such benefit was fully offset by an increase in the
valuation allowance.
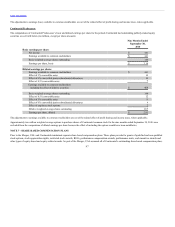
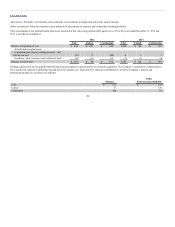
We are required to consider all items of income (including items recorded in other comprehensive income) in determining the amount of tax benefit that should
be allocated to a loss from continuing operations. As a result, Continental Successor recorded $6 million of non-cash tax benefits on its loss from continuing
operations for the three months ended December 31, 2010, which was exactly offset by income tax expense in other comprehensive income, a component of
stockholder’s equity. Because the income tax expense on other comprehensive income is equal to the income tax benefit from continuing operations,
Continental’s net deferred tax positions at December 31, 2010 was not impacted by this tax allocation.
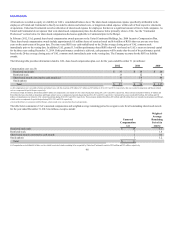
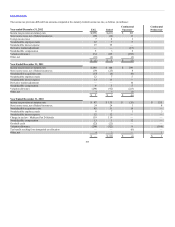
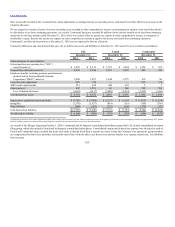
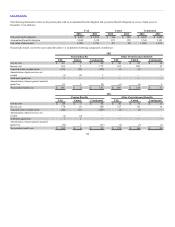
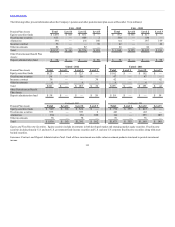
Temporary differences and carryforwards that give rise to deferred tax assets and liabilities at December 31, 2012 and 2011 were as follows (in millions):
Deferred income tax asset (liability):
Federal and state net operating loss (“NOL”)
carryforwards (a) $ 3,025 $ 2,911 $ 1,707 $ 2,024 $ 1,250 $ 835
Frequent flyer deferred revenue (a) 2,425 2,386 1,931 1,487 495 903
Employee benefits, including pension, postretirement,
medical and the Pension Benefit Guaranty
Corporation (“PBGC”) notes (a) 2,488 1,897 1,648 1,275 843 703
Lease fair value adjustment 259 376 — — 259 376
AMT credit carryforwards 251 268 246 263 5 5
Other assets (a) 947 1,251 343 560 539 581
Less: Valuation allowance (4,603) (4,137) (3,068) (2,614) (1,435) (1,434)
Total deferred tax assets $ 4,792 $ 4,952 $ 2,807 $ 2,995 $ 1,956 $ 1,969
Depreciation, capitalized interest and other $ (3,705) $ (3,860) $ (2,137) $ (2,303) $ (1,565) $ (1,554)
Intangibles (1,578) (1,627) (819) (833) (760) (795)
Other liabilities (509) (453) (227) (218) (179) (173)
Total deferred tax liabilities $(5,792) $ (5,940) $ (3,183) $ (3,354) $ (2,504) $ (2,522)
Net deferred tax liability $ (1,000) $ (988) $ (376) $ (359) $ (548) $ (553)
(a) Deferred tax assets for 2012 reflect adjustments made in the current year to increase UAL and United’s deferred tax assets for frequent flyer deferred revenue and employee benefits by approximately $257 million
and $187 million, respectively, and to reduce net operating loss carryforwards and other deferred tax assets by the same amounts.
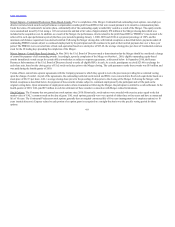
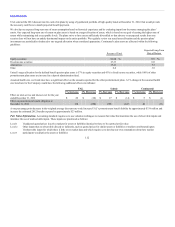
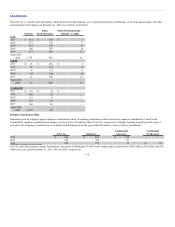
As a result of the Merger, beginning October 1, 2010, Continental and its domestic consolidated subsidiaries joined the UAL federal consolidated tax return
filing group, which also includes United and its domestic consolidated subsidiaries. Consolidated current and deferred tax expense was allocated to each of
United and Continental using a method that treats each entity as though it had filed a separate tax return. Under the Company’s tax agreement, group members
are compensated for their losses and other tax benefits only if they would be able to use those losses and tax benefits on a separate return basis. Tax liabilities
between group
105