United Airlines 2012 Annual Report Download - page 47
Download and view the complete annual report
Please find page 47 of the 2012 United Airlines annual report below. You can navigate through the pages in the report by either clicking on the pages listed below, or by using the keyword search tool below to find specific information within the annual report.-
 1
1 -
2
-
3
-
4
-
5
-
6
-
7
-
8
-
9
-
10
-
11
-
12
-
13
-
14
-
15
-
16
-
17
-
18
-
19
-
20
-
21
-
22
-
23
-
24
-
25
-
26
-
27
-
28
-
29
-
30
-
31
-
32
-
33
-
34
-
35
-
36
-
 37
37 -
 38
38 -
 39
39 -
 40
40 -
 41
41 -
 42
42 -
 43
43 -
 44
44 -
 45
45 -
 46
46 -
 47
47 -
 48
48 -
 49
49 -
 50
50 -
 51
51 -
 52
52 -
 53
53 -
 54
54 -
 55
55 -
 56
56 -
 57
57 -
58
-
59
-
60
-
61
-
62
-
63
-
64
-
65
-
66
-
67
-
68
-
69
-
70
-
71
-
72
-
73
-
74
-
75
-
76
-
77
-
78
-
79
-
80
-
81
-
82
-
83
-
84
-
85
-
86
-
87
-
88
-
89
-
90
-
91
-
92
-
93
-
94
-
95
-
96
-
97
-
98
-
99
-
100
-
101
-
102
-
103
-
104
-
105
-
106
-
107
-
108
-
109
-
110
-
111
-
112
-
113
-
114
-
115
-
116
-
117
-
118
-
119
-
120
-
121
-
122
-
123
-
124
-
125
-
126
-
127
-
128
-
129
-
130
-
131
-
132
-
133
-
134
-
135
-
136
-
137
-
138
-
139
-
140
-
141
-
142
-
143
-
144
-
145
-
146
-
147
-
148
-
149
-
150
-
151
-
152
-
153
-
154
-
155
-
156
-
157
-
158
-
159
-
160
-
161
-
162
-
163
-
164
-
165
-
166
-
167
-
168
-
169
-
170
-
171
-
172
-
173
-
174
-
175
-
176
-
177
-
178
-
179
-
180
-
181
-
182
-
183
-
184
-
185
-
186
-
187
-
188
-
189
-
190
-
191
-
192
-
193
-
194
-
195
-
196
-
197
-
198
-
199
-
200
-
201
-
202
-
203
-
204
-
205
-
206
-
207
-
208
-
209
-
210
-
211
-
212
-
213
-
214
-
215
-
216
-
217
-
218
-
219
-
220
-
221
-
222
-
223
-
224
-
225
-
226
-
227
-
228
-
229
-
230
-
231
-
232
-
233
-
234
-
235
-
236
-
237
-
238
-
239
-
240
-
241
-
242
-
243
-
244
-
245
-
246
-
247
-
248
-
249
-
250
-
251
-
252
-
253
-
254
-
255
-
256
-
257
-
258
-
259
-
260
-
261
-
262
-
263
-
264
-
265
-
266
-
267
-
268
-
269
-
270
-
271
-
272
-
273
-
274
-
275
-
276
-
277
-
278
-
279
-
280
-
281
-
282
-
283
-
284
-
285
-
286
-
287
-
288
-
289
-
290
-
291
-
292
-
293
-
294
-
295
-
296
-
297
-
298
-
299
-
300
-
301
-
302
-
303
-
304
-
305
-
306
-
307
-
308
-
309
-
310
-
311
-
312
-
313
-
314
-
315
-
316
-
317
-
318
-
319
-
320
-
321
-
322
-
323
-
324
-
325
-
326
-
327
-
328
-
329
-
330
-
331
-
332
-
333
-
334
-
335
-
336
-
337
-
338
-
339
-
340
-
341
-
342
-
343
-
344
-
345
-
346
-
347
-
348
-
349
-
350
-
351
-
352
-
353
-
354
-
355
-
356
-
357
-
358
-
359
-
360
-
361
-
362
-
363
-
364
-
365
-
366
-
367
-
368
-
369
-
370
-
371
-
372
-
373
-
374
-
375
-
376
-
377
-
378
-
379
-
380
-
381
-
382
-
383
-
384
-
385
-
386
-
387
-
388
-
389
-
390
-
391
-
392
-
393
-
394
-
395
-
396
-
397
-
398
-
399
-
400
-
401
-
402
-
403
-
404
-
405
-
406
-
407
-
408
-
409
-
410
-
411
-
412
-
413
-
414
-
415
-
416
-
417
-
418
-
419
-
420
-
421
-
422
-
423
-
424
-
425
-
426
-
427
-
428
-
429
-
430
-
431
-
432
-
433
-
434
-
435
-
436
-
437
-
438
-
439
-
440
-
441
-
442
-
443
-
444
-
445
-
446
-
447
-
448
-
449
-
450
-
451
-
452
-
453
-
454
-
455
-
456
-
457
-
458
-
459
-
460
-
461
 |
 |

Table of Contents
Continental
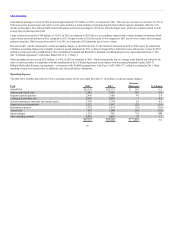
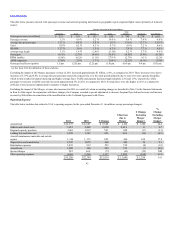
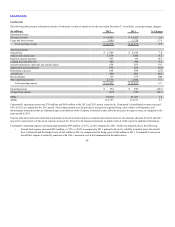
The following table presents information related to Continental’s results of operations for the year ended December 31 (in millions, except percentage changes):
Operating Revenue:
Passenger revenue $ 14,991 $ 14,417 4.0
Cargo and other revenue 1,984 1,758 12.9
Total operating revenue $ 16,975 $ 16,175 4.9
Operating Expense:
Aircraft fuel $ 5,709 $ 5,294 7.8
Salaries and related costs 3,559 3,405 4.5
Regional capacity purchase 963 830 16.0
Landing fees and other rent 902 900 0.2
Aircraft maintenance materials and outside repairs 654 595 9.9
Depreciation and amortization 592 626 (5.4)
Distribution expenses 668 688 (2.9)
Aircraft rent 680 686 (0.9)
Special charges 339 159 NM
Other operating expenses 2,155 2,042 5.5
Total operating expense $ 16,221 $ 15,225 6.5
Operating income $ 754 $ 950 (20.6)
Nonoperating expense (232) (387) (40.1)
RPMs 92,530 91,453 1.2
ASMs 112,797 112,713 0.1
Continental’s operating income was $754 million and $950 million in the 2012 and 2011 period, respectively. Continental’s consolidated revenue increased
4.9% in 2012 as compared to the 2011 period. These improvements were largely due to increases in regional flying, sales of miles to third parties, and
intercompany transactions that are eliminated upon consolidation of the Company’s financial results, offset by decreases in cargo revenue, as compared to the
same period in 2011.
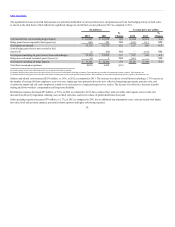
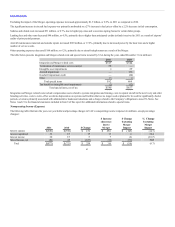
Expense allocations between United and Continental are based on metrics that are systematic and rational; however, the amounts allocated for 2012 and 2011
may not be representative of the actual expenses incurred. See Note 20 to the financial statements included in Item 8 of this report for additional information.
Continental’s operating expenses increased approximately $996 million, or 6.5%, in 2012 compared to 2011, which was primarily due to the following:
• Aircraft fuel expense increased $415 million, or 7.8%, in 2012 as compared to 2011, primarily driven by volatility in market prices for aircraft
fuel. Continental had fuel hedge losses of $65 million in 2012 as compared to fuel hedge gains of $86 million in 2011. Continental’s increase in
aircraft fuel expense is relatively consistent with UAL’s increased cost of fuel summarized in the tables above;
46