United Airlines 2012 Annual Report Download - page 122
Download and view the complete annual report
Please find page 122 of the 2012 United Airlines annual report below. You can navigate through the pages in the report by either clicking on the pages listed below, or by using the keyword search tool below to find specific information within the annual report.-
 1
1 -
2
-
3
-
4
-
5
-
6
-
7
-
8
-
9
-
10
-
11
-
12
-
13
-
14
-
15
-
16
-
17
-
18
-
19
-
20
-
21
-
22
-
23
-
24
-
25
-
26
-
27
-
28
-
29
-
30
-
31
-
32
-
33
-
34
-
35
-
36
-
37
-
38
-
39
-
40
-
41
-
42
-
43
-
44
-
45
-
46
-
47
-
48
-
49
-
50
-
51
-
52
-
53
-
54
-
55
-
56
-
57
-
58
-
59
-
60
-
61
-
62
-
63
-
64
-
65
-
66
-
67
-
68
-
69
-
70
-
71
-
72
-
73
-
74
-
75
-
76
-
77
-
78
-
79
-
80
-
81
-
82
-
83
-
84
-
85
-
86
-
87
-
88
-
89
-
90
-
91
-
92
-
93
-
94
-
95
-
96
-
97
-
98
-
99
-
100
-
101
-
102
-
103
-
104
-
105
-
106
-
107
-
108
-
109
-
110
-
111
-
 112
112 -
 113
113 -
 114
114 -
 115
115 -
 116
116 -
 117
117 -
 118
118 -
 119
119 -
 120
120 -
 121
121 -
 122
122 -
 123
123 -
 124
124 -
 125
125 -
 126
126 -
 127
127 -
 128
128 -
 129
129 -
 130
130 -
 131
131 -
 132
132 -
133
-
134
-
135
-
136
-
137
-
138
-
139
-
140
-
141
-
142
-
143
-
144
-
145
-
146
-
147
-
148
-
149
-
150
-
151
-
152
-
153
-
154
-
155
-
156
-
157
-
158
-
159
-
160
-
161
-
162
-
163
-
164
-
165
-
166
-
167
-
168
-
169
-
170
-
171
-
172
-
173
-
174
-
175
-
176
-
177
-
178
-
179
-
180
-
181
-
182
-
183
-
184
-
185
-
186
-
187
-
188
-
189
-
190
-
191
-
192
-
193
-
194
-
195
-
196
-
197
-
198
-
199
-
200
-
201
-
202
-
203
-
204
-
205
-
206
-
207
-
208
-
209
-
210
-
211
-
212
-
213
-
214
-
215
-
216
-
217
-
218
-
219
-
220
-
221
-
222
-
223
-
224
-
225
-
226
-
227
-
228
-
229
-
230
-
231
-
232
-
233
-
234
-
235
-
236
-
237
-
238
-
239
-
240
-
241
-
242
-
243
-
244
-
245
-
246
-
247
-
248
-
249
-
250
-
251
-
252
-
253
-
254
-
255
-
256
-
257
-
258
-
259
-
260
-
261
-
262
-
263
-
264
-
265
-
266
-
267
-
268
-
269
-
270
-
271
-
272
-
273
-
274
-
275
-
276
-
277
-
278
-
279
-
280
-
281
-
282
-
283
-
284
-
285
-
286
-
287
-
288
-
289
-
290
-
291
-
292
-
293
-
294
-
295
-
296
-
297
-
298
-
299
-
300
-
301
-
302
-
303
-
304
-
305
-
306
-
307
-
308
-
309
-
310
-
311
-
312
-
313
-
314
-
315
-
316
-
317
-
318
-
319
-
320
-
321
-
322
-
323
-
324
-
325
-
326
-
327
-
328
-
329
-
330
-
331
-
332
-
333
-
334
-
335
-
336
-
337
-
338
-
339
-
340
-
341
-
342
-
343
-
344
-
345
-
346
-
347
-
348
-
349
-
350
-
351
-
352
-
353
-
354
-
355
-
356
-
357
-
358
-
359
-
360
-
361
-
362
-
363
-
364
-
365
-
366
-
367
-
368
-
369
-
370
-
371
-
372
-
373
-
374
-
375
-
376
-
377
-
378
-
379
-
380
-
381
-
382
-
383
-
384
-
385
-
386
-
387
-
388
-
389
-
390
-
391
-
392
-
393
-
394
-
395
-
396
-
397
-
398
-
399
-
400
-
401
-
402
-
403
-
404
-
405
-
406
-
407
-
408
-
409
-
410
-
411
-
412
-
413
-
414
-
415
-
416
-
417
-
418
-
419
-
420
-
421
-
422
-
423
-
424
-
425
-
426
-
427
-
428
-
429
-
430
-
431
-
432
-
433
-
434
-
435
-
436
-
437
-
438
-
439
-
440
-
441
-
442
-
443
-
444
-
445
-
446
-
447
-
448
-
449
-
450
-
451
-
452
-
453
-
454
-
455
-
456
-
457
-
458
-
459
-
460
-
461
 |
 |

Table of Contents
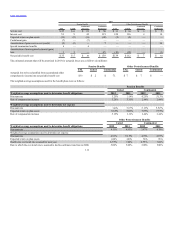
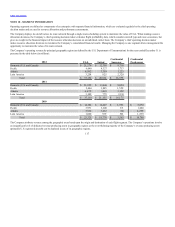
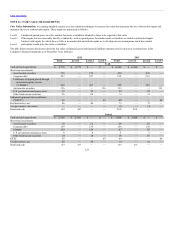
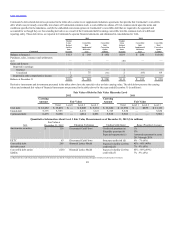
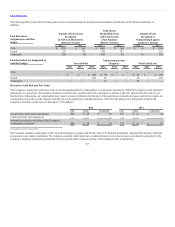
Fair Value Information. Accounting standards require us to use valuation techniques to measure fair value that maximize the use of observable inputs and
minimize the use of unobservable inputs. These inputs are prioritized as follows:
Level 1 Unadjusted quoted prices in active markets for assets or liabilities identical to those to be reported at fair value
Level 2 Other inputs that are observable directly or indirectly, such as quoted prices for similar assets or liabilities or market-corroborated inputs
Level 3
Unobservable inputs for which there is little or no market data and which require us to develop our own assumptions about how market
participants would price the assets or liabilities
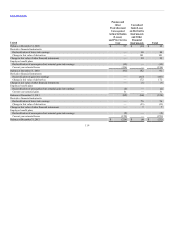
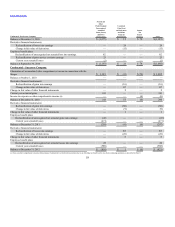
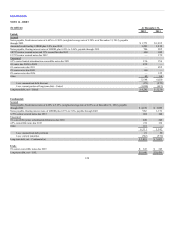
The table below presents disclosures about the fair value of financial assets and financial liabilities measured at fair value on a recurring basis in the
Company’s financial statements as of December 31 (in millions):
Cash and cash equivalents $ 4,770 $ 4,770 $ — $ — $ 6,246 $ 6,246 $ — $ —
Short-term investments:
Asset-backed securities 715 — 715 — 478 — 478 —
Corporate debt 537 — 537 — 515 — 515 —
Certificates of deposit placed through
an account registry service
(“CDARS”) 367 — 367 — 355 — 355 —
Auction rate securities 116 — — 116 113 — — 113
U.S. government and agency notes 12 — 12 — 22 — 22 —
Other fixed income securities 26 — 26 — 33 — 33 —
Enhanced equipment trust certificates
(“EETC”) 63 — — 63 60 — — 60
Fuel derivatives, net 46 — 46 — 73 — 73 —
Foreign currency derivatives — — — — (1) — (1) —
Restricted cash 447 447 — — 569 569 — —
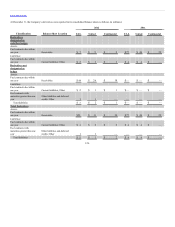
Cash and cash equivalents $ 2,766 $ 2,766 $ — $ — $ 3,458 $ 3,458 $ — $ —
Short-term investments:
Asset-backed securities 16 — 16 — 29 — 29 —
Corporate debt 139 — 139 — 138 — 138 —
CDARS 139 — 139 — 87 — 87 —
U.S. government and agency notes 8 — 8 — 5 — 5 —
Other fixed income securities 24 — 24 — 16 — 16 —
EETC 63 — — 63 60 — — 60
Fuel derivatives, net 28 — 28 — 44 — 44 —
Restricted cash 337 337 — — 433 433 — —
121