United Airlines 2012 Annual Report Download - page 124
Download and view the complete annual report
Please find page 124 of the 2012 United Airlines annual report below. You can navigate through the pages in the report by either clicking on the pages listed below, or by using the keyword search tool below to find specific information within the annual report.-
 1
1 -
2
-
3
-
4
-
5
-
6
-
7
-
8
-
9
-
10
-
11
-
12
-
13
-
14
-
15
-
16
-
17
-
18
-
19
-
20
-
21
-
22
-
23
-
24
-
25
-
26
-
27
-
28
-
29
-
30
-
31
-
32
-
33
-
34
-
35
-
36
-
37
-
38
-
39
-
40
-
41
-
42
-
43
-
44
-
45
-
46
-
47
-
48
-
49
-
50
-
51
-
52
-
53
-
54
-
55
-
56
-
57
-
58
-
59
-
60
-
61
-
62
-
63
-
64
-
65
-
66
-
67
-
68
-
69
-
70
-
71
-
72
-
73
-
74
-
75
-
76
-
77
-
78
-
79
-
80
-
81
-
82
-
83
-
84
-
85
-
86
-
87
-
88
-
89
-
90
-
91
-
92
-
93
-
94
-
95
-
96
-
97
-
98
-
99
-
100
-
101
-
102
-
103
-
104
-
105
-
106
-
107
-
108
-
109
-
110
-
111
-
112
-
113
-
 114
114 -
 115
115 -
 116
116 -
 117
117 -
 118
118 -
 119
119 -
 120
120 -
 121
121 -
 122
122 -
 123
123 -
 124
124 -
 125
125 -
 126
126 -
 127
127 -
 128
128 -
 129
129 -
 130
130 -
 131
131 -
 132
132 -
 133
133 -
 134
134 -
135
-
136
-
137
-
138
-
139
-
140
-
141
-
142
-
143
-
144
-
145
-
146
-
147
-
148
-
149
-
150
-
151
-
152
-
153
-
154
-
155
-
156
-
157
-
158
-
159
-
160
-
161
-
162
-
163
-
164
-
165
-
166
-
167
-
168
-
169
-
170
-
171
-
172
-
173
-
174
-
175
-
176
-
177
-
178
-
179
-
180
-
181
-
182
-
183
-
184
-
185
-
186
-
187
-
188
-
189
-
190
-
191
-
192
-
193
-
194
-
195
-
196
-
197
-
198
-
199
-
200
-
201
-
202
-
203
-
204
-
205
-
206
-
207
-
208
-
209
-
210
-
211
-
212
-
213
-
214
-
215
-
216
-
217
-
218
-
219
-
220
-
221
-
222
-
223
-
224
-
225
-
226
-
227
-
228
-
229
-
230
-
231
-
232
-
233
-
234
-
235
-
236
-
237
-
238
-
239
-
240
-
241
-
242
-
243
-
244
-
245
-
246
-
247
-
248
-
249
-
250
-
251
-
252
-
253
-
254
-
255
-
256
-
257
-
258
-
259
-
260
-
261
-
262
-
263
-
264
-
265
-
266
-
267
-
268
-
269
-
270
-
271
-
272
-
273
-
274
-
275
-
276
-
277
-
278
-
279
-
280
-
281
-
282
-
283
-
284
-
285
-
286
-
287
-
288
-
289
-
290
-
291
-
292
-
293
-
294
-
295
-
296
-
297
-
298
-
299
-
300
-
301
-
302
-
303
-
304
-
305
-
306
-
307
-
308
-
309
-
310
-
311
-
312
-
313
-
314
-
315
-
316
-
317
-
318
-
319
-
320
-
321
-
322
-
323
-
324
-
325
-
326
-
327
-
328
-
329
-
330
-
331
-
332
-
333
-
334
-
335
-
336
-
337
-
338
-
339
-
340
-
341
-
342
-
343
-
344
-
345
-
346
-
347
-
348
-
349
-
350
-
351
-
352
-
353
-
354
-
355
-
356
-
357
-
358
-
359
-
360
-
361
-
362
-
363
-
364
-
365
-
366
-
367
-
368
-
369
-
370
-
371
-
372
-
373
-
374
-
375
-
376
-
377
-
378
-
379
-
380
-
381
-
382
-
383
-
384
-
385
-
386
-
387
-
388
-
389
-
390
-
391
-
392
-
393
-
394
-
395
-
396
-
397
-
398
-
399
-
400
-
401
-
402
-
403
-
404
-
405
-
406
-
407
-
408
-
409
-
410
-
411
-
412
-
413
-
414
-
415
-
416
-
417
-
418
-
419
-
420
-
421
-
422
-
423
-
424
-
425
-
426
-
427
-
428
-
429
-
430
-
431
-
432
-
433
-
434
-
435
-
436
-
437
-
438
-
439
-
440
-
441
-
442
-
443
-
444
-
445
-
446
-
447
-
448
-
449
-
450
-
451
-
452
-
453
-
454
-
455
-
456
-
457
-
458
-
459
-
460
-
461
 |
 |

Table of Contents
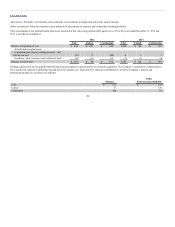
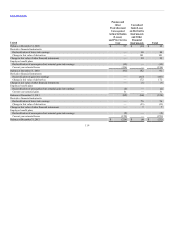
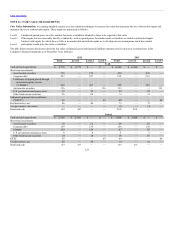
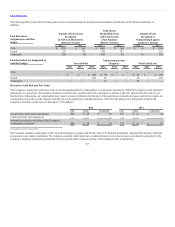
Continental’s debt-related derivatives presented in the tables above relate to (a) supplemental indenture agreements that provide that Continental’s convertible
debt, which was previously convertible into shares of Continental common stock, is convertible into shares of UAL common stock upon the terms and
conditions specified in the indentures, and (b) the embedded conversion options in Continental’s convertible debt that are required to be separated and
accounted for as though they are free-standing derivatives as a result of the Continental debt becoming convertible into the common stock of a different
reporting entity. These derivatives are reported in Continental’s separate financial statements and eliminated in consolidation for UAL.
Balance at January 1 $113 $ 193 $ (95) $119 $ 286 $ (164)
Purchases, sales, issuances and settlements
(net) — — — (10) — —
Gains and (losses):
Reported in earnings:
Realized — — — 1 — —
Unrealized 1 75 (33) 2 (93) 69
Reported in other comprehensive income 2 — — 1 — —
Balance at December 31 $116 $ 268 $ (128) $113 $ 193 $ (95)
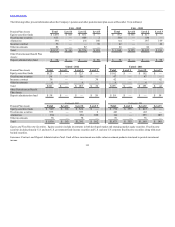
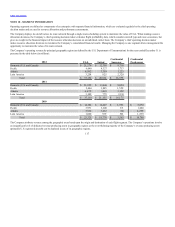
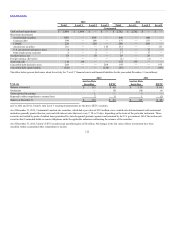
Derivative instruments and investments presented in the tables above have the same fair value as their carrying value. The table below presents the carrying
values and estimated fair values of financial instruments not presented in the tables above for the years ended December 31 (in millions):
Total Level 1 Level 2 Level 3 Total Level 1 Level 2 Level 3
UAL debt $ 12,252 $ 13,419 $ — $ 8,045 $ 5,374 $ 11,682 $ 11,992 $ — $859 $ 11,133
United debt 5,375 5,595 — 2,272 3,323 5,745 5,630 — — 5,630
Continental debt 6,475 6,865 — 4,814 2,051 5,528 5,503 — — 5,503
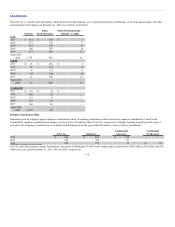
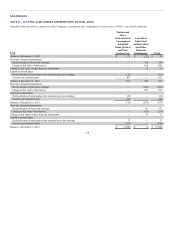
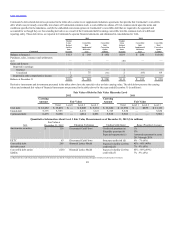
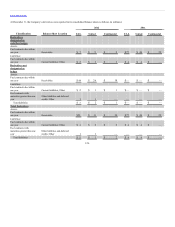
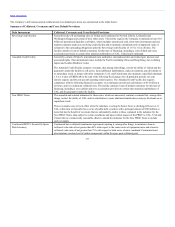
Item
Fair Value at
December 31, 2012 Valuation Technique Unobservable Input Range (Weighted Average)
Auction rate securities $116 Discounted Cash Flows Credit risk premium (a) 1%
Illiquidity premium (b) 5%
Expected repayments (c)
Assumed repayment in years
2013 through 2036
EETC 63 Discounted Cash Flows Structure credit risk (d) 6% - 7% (6%)
Convertible debt
derivative asset
268
Binomial Lattice Model
Expected volatility (e) Own
credit risk (f)
45% - 60% (48%)
7% - 9% (8%)
Convertible debt option
liability
(128)
Binomial Lattice Model
Expected volatility (e) Own
credit risk (f)
45% - 60% (49%)
7% - 9% (8%)
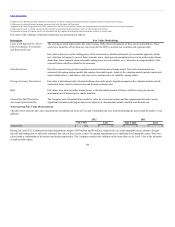
(a) Represents the credit risk premium component of the discount rate that the Company has determined market participants would use in pricing the investments.
123