United Airlines 2012 Annual Report Download - page 34
Download and view the complete annual report
Please find page 34 of the 2012 United Airlines annual report below. You can navigate through the pages in the report by either clicking on the pages listed below, or by using the keyword search tool below to find specific information within the annual report.-
 1
1 -
2
-
3
-
4
-
5
-
6
-
7
-
8
-
9
-
10
-
11
-
12
-
13
-
14
-
15
-
16
-
17
-
18
-
19
-
20
-
21
-
22
-
23
-
 24
24 -
 25
25 -
 26
26 -
 27
27 -
 28
28 -
 29
29 -
 30
30 -
 31
31 -
 32
32 -
 33
33 -
 34
34 -
 35
35 -
 36
36 -
 37
37 -
 38
38 -
 39
39 -
 40
40 -
 41
41 -
 42
42 -
 43
43 -
 44
44 -
45
-
46
-
47
-
48
-
49
-
50
-
51
-
52
-
53
-
54
-
55
-
56
-
57
-
58
-
59
-
60
-
61
-
62
-
63
-
64
-
65
-
66
-
67
-
68
-
69
-
70
-
71
-
72
-
73
-
74
-
75
-
76
-
77
-
78
-
79
-
80
-
81
-
82
-
83
-
84
-
85
-
86
-
87
-
88
-
89
-
90
-
91
-
92
-
93
-
94
-
95
-
96
-
97
-
98
-
99
-
100
-
101
-
102
-
103
-
104
-
105
-
106
-
107
-
108
-
109
-
110
-
111
-
112
-
113
-
114
-
115
-
116
-
117
-
118
-
119
-
120
-
121
-
122
-
123
-
124
-
125
-
126
-
127
-
128
-
129
-
130
-
131
-
132
-
133
-
134
-
135
-
136
-
137
-
138
-
139
-
140
-
141
-
142
-
143
-
144
-
145
-
146
-
147
-
148
-
149
-
150
-
151
-
152
-
153
-
154
-
155
-
156
-
157
-
158
-
159
-
160
-
161
-
162
-
163
-
164
-
165
-
166
-
167
-
168
-
169
-
170
-
171
-
172
-
173
-
174
-
175
-
176
-
177
-
178
-
179
-
180
-
181
-
182
-
183
-
184
-
185
-
186
-
187
-
188
-
189
-
190
-
191
-
192
-
193
-
194
-
195
-
196
-
197
-
198
-
199
-
200
-
201
-
202
-
203
-
204
-
205
-
206
-
207
-
208
-
209
-
210
-
211
-
212
-
213
-
214
-
215
-
216
-
217
-
218
-
219
-
220
-
221
-
222
-
223
-
224
-
225
-
226
-
227
-
228
-
229
-
230
-
231
-
232
-
233
-
234
-
235
-
236
-
237
-
238
-
239
-
240
-
241
-
242
-
243
-
244
-
245
-
246
-
247
-
248
-
249
-
250
-
251
-
252
-
253
-
254
-
255
-
256
-
257
-
258
-
259
-
260
-
261
-
262
-
263
-
264
-
265
-
266
-
267
-
268
-
269
-
270
-
271
-
272
-
273
-
274
-
275
-
276
-
277
-
278
-
279
-
280
-
281
-
282
-
283
-
284
-
285
-
286
-
287
-
288
-
289
-
290
-
291
-
292
-
293
-
294
-
295
-
296
-
297
-
298
-
299
-
300
-
301
-
302
-
303
-
304
-
305
-
306
-
307
-
308
-
309
-
310
-
311
-
312
-
313
-
314
-
315
-
316
-
317
-
318
-
319
-
320
-
321
-
322
-
323
-
324
-
325
-
326
-
327
-
328
-
329
-
330
-
331
-
332
-
333
-
334
-
335
-
336
-
337
-
338
-
339
-
340
-
341
-
342
-
343
-
344
-
345
-
346
-
347
-
348
-
349
-
350
-
351
-
352
-
353
-
354
-
355
-
356
-
357
-
358
-
359
-
360
-
361
-
362
-
363
-
364
-
365
-
366
-
367
-
368
-
369
-
370
-
371
-
372
-
373
-
374
-
375
-
376
-
377
-
378
-
379
-
380
-
381
-
382
-
383
-
384
-
385
-
386
-
387
-
388
-
389
-
390
-
391
-
392
-
393
-
394
-
395
-
396
-
397
-
398
-
399
-
400
-
401
-
402
-
403
-
404
-
405
-
406
-
407
-
408
-
409
-
410
-
411
-
412
-
413
-
414
-
415
-
416
-
417
-
418
-
419
-
420
-
421
-
422
-
423
-
424
-
425
-
426
-
427
-
428
-
429
-
430
-
431
-
432
-
433
-
434
-
435
-
436
-
437
-
438
-
439
-
440
-
441
-
442
-
443
-
444
-
445
-
446
-
447
-
448
-
449
-
450
-
451
-
452
-
453
-
454
-
455
-
456
-
457
-
458
-
459
-
460
-
461
 |
 |

Table of Contents
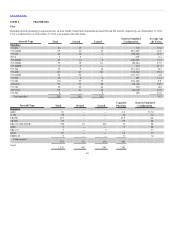
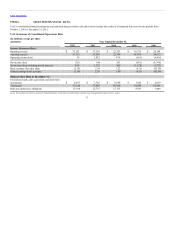
(c) The number of seats available for passengers multiplied by the number of scheduled miles those seats are flown.
(d) RPM divided by ASM.
(e) The average passenger revenue received for each revenue passenger mile flown.
(f) Passenger revenue divided by number of passengers.
(g) Excludes aircraft that were removed from service. Regional aircraft include aircraft operated by all carriers under capacity purchase agreements, but exclude any aircraft that were subleased to other operators
but not operated on our behalf.
(h) Average stage length equals the average distance a flight travels weighted for size of aircraft.
(i) The average number of hours per day that an aircraft flown in revenue service is operated (from gate departure to gate arrival).
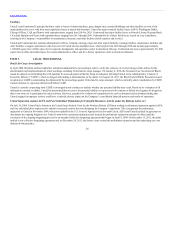
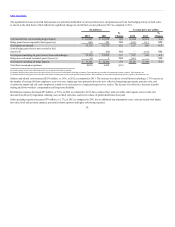
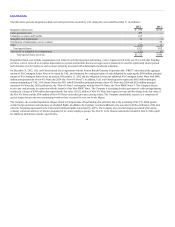
UAL evaluates its financial performance utilizing various accounting principles generally accepted in the United States of America (“GAAP”) and non-GAAP
financial measures including net income/loss, net earnings/loss per share and cost per available sent mile (“CASM”), among others. CASM is a common
metric used in the airline industry to measure an airline’s cost structure and efficiency. UAL believes that excluding fuel costs from certain measures is useful
to investors because it provides an additional measure of management’s performance excluding the effects of a significant cost item over which management
has limited influence. Fuel hedge mark-to-market (“MTM”) gains (losses) are excluded as UAL did not apply cash flow hedge accounting for certain of the
periods presented, and these adjustments may provide a better comparison to UAL’s peers, most of which either apply cash flow hedge accounting or exclude
cash MTM gains or losses in certain disclosures of fuel expense. UAL believes that adjusting for special items is useful to investors because the special items
are non-recurring items not indicative of UAL’s ongoing performance. UAL also believes that excluding third-party business expenses, such as maintenance,
ground handling and catering services for third parties, fuel sales and non-air mileage redemptions, provides more meaningful disclosure because these
expenses are not directly related to UAL’s core business. Pursuant to SEC Regulation G, UAL has included the following reconciliation of reported non-GAAP
financial measures to comparable financial measures reported on a GAAP basis (in millions, except CASM amounts). For further information related to
special items, see Note 21 to the financial statements included in Item 8 of this report.
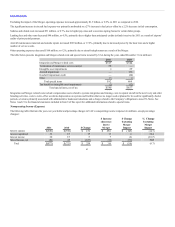
Net income (loss) $ (723) $ 840 $ 253 $ (651) $(5,396)
Total special items - income (expense)
(see detail below) (1,312) (483) (689) 477 (3,623)
Net income (loss) excluding special items $ 589 $1,323 $ 942 $(1,128) $ (1,773)
Special revenue item $ — $ 107 $ — $ — $ —
Merger and integration-related costs (739) (517) (564) — —
Labor agreement costs (475) — — — —
Voluntary severance and benefits (125) — — — —
Goodwill impairment (charge) credit — — 64 — (2,277)
Other intangible impairments (30) (4) (29) (150) (64)
Other asset impairments — — (136) (93) (250)
Municipal bond litigation — — — (27) —
Termination of maintenance service contract — (58) — — —
Other 46 (13) (4) (104) (25)
Special operating expense (1,323) (592) (669) (374) (2,616)
Other operating expense items — — — (35) (191)
Operating non-cash MTM gain (loss) — — (32) 586 (568)
Non-operating non-cash MTM gain (loss) (a) — — — 279 (279)
Other expense items — — (32) 830 (1,038)
Income tax benefit 11 2 12 21 31
Total special items (b) $(1,312) $ (483) $(689) $ 477 $ (3,623)
33