United Airlines 2012 Annual Report Download - page 125
Download and view the complete annual report
Please find page 125 of the 2012 United Airlines annual report below. You can navigate through the pages in the report by either clicking on the pages listed below, or by using the keyword search tool below to find specific information within the annual report.-
 1
1 -
2
-
3
-
4
-
5
-
6
-
7
-
8
-
9
-
10
-
11
-
12
-
13
-
14
-
15
-
16
-
17
-
18
-
19
-
20
-
21
-
22
-
23
-
24
-
25
-
26
-
27
-
28
-
29
-
30
-
31
-
32
-
33
-
34
-
35
-
36
-
37
-
38
-
39
-
40
-
41
-
42
-
43
-
44
-
45
-
46
-
47
-
48
-
49
-
50
-
51
-
52
-
53
-
54
-
55
-
56
-
57
-
58
-
59
-
60
-
61
-
62
-
63
-
64
-
65
-
66
-
67
-
68
-
69
-
70
-
71
-
72
-
73
-
74
-
75
-
76
-
77
-
78
-
79
-
80
-
81
-
82
-
83
-
84
-
85
-
86
-
87
-
88
-
89
-
90
-
91
-
92
-
93
-
94
-
95
-
96
-
97
-
98
-
99
-
100
-
101
-
102
-
103
-
104
-
105
-
106
-
107
-
108
-
109
-
110
-
111
-
112
-
113
-
114
-
 115
115 -
 116
116 -
 117
117 -
 118
118 -
 119
119 -
 120
120 -
 121
121 -
 122
122 -
 123
123 -
 124
124 -
 125
125 -
 126
126 -
 127
127 -
 128
128 -
 129
129 -
 130
130 -
 131
131 -
 132
132 -
 133
133 -
 134
134 -
 135
135 -
136
-
137
-
138
-
139
-
140
-
141
-
142
-
143
-
144
-
145
-
146
-
147
-
148
-
149
-
150
-
151
-
152
-
153
-
154
-
155
-
156
-
157
-
158
-
159
-
160
-
161
-
162
-
163
-
164
-
165
-
166
-
167
-
168
-
169
-
170
-
171
-
172
-
173
-
174
-
175
-
176
-
177
-
178
-
179
-
180
-
181
-
182
-
183
-
184
-
185
-
186
-
187
-
188
-
189
-
190
-
191
-
192
-
193
-
194
-
195
-
196
-
197
-
198
-
199
-
200
-
201
-
202
-
203
-
204
-
205
-
206
-
207
-
208
-
209
-
210
-
211
-
212
-
213
-
214
-
215
-
216
-
217
-
218
-
219
-
220
-
221
-
222
-
223
-
224
-
225
-
226
-
227
-
228
-
229
-
230
-
231
-
232
-
233
-
234
-
235
-
236
-
237
-
238
-
239
-
240
-
241
-
242
-
243
-
244
-
245
-
246
-
247
-
248
-
249
-
250
-
251
-
252
-
253
-
254
-
255
-
256
-
257
-
258
-
259
-
260
-
261
-
262
-
263
-
264
-
265
-
266
-
267
-
268
-
269
-
270
-
271
-
272
-
273
-
274
-
275
-
276
-
277
-
278
-
279
-
280
-
281
-
282
-
283
-
284
-
285
-
286
-
287
-
288
-
289
-
290
-
291
-
292
-
293
-
294
-
295
-
296
-
297
-
298
-
299
-
300
-
301
-
302
-
303
-
304
-
305
-
306
-
307
-
308
-
309
-
310
-
311
-
312
-
313
-
314
-
315
-
316
-
317
-
318
-
319
-
320
-
321
-
322
-
323
-
324
-
325
-
326
-
327
-
328
-
329
-
330
-
331
-
332
-
333
-
334
-
335
-
336
-
337
-
338
-
339
-
340
-
341
-
342
-
343
-
344
-
345
-
346
-
347
-
348
-
349
-
350
-
351
-
352
-
353
-
354
-
355
-
356
-
357
-
358
-
359
-
360
-
361
-
362
-
363
-
364
-
365
-
366
-
367
-
368
-
369
-
370
-
371
-
372
-
373
-
374
-
375
-
376
-
377
-
378
-
379
-
380
-
381
-
382
-
383
-
384
-
385
-
386
-
387
-
388
-
389
-
390
-
391
-
392
-
393
-
394
-
395
-
396
-
397
-
398
-
399
-
400
-
401
-
402
-
403
-
404
-
405
-
406
-
407
-
408
-
409
-
410
-
411
-
412
-
413
-
414
-
415
-
416
-
417
-
418
-
419
-
420
-
421
-
422
-
423
-
424
-
425
-
426
-
427
-
428
-
429
-
430
-
431
-
432
-
433
-
434
-
435
-
436
-
437
-
438
-
439
-
440
-
441
-
442
-
443
-
444
-
445
-
446
-
447
-
448
-
449
-
450
-
451
-
452
-
453
-
454
-
455
-
456
-
457
-
458
-
459
-
460
-
461
 |
 |

Table of Contents
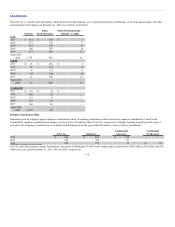
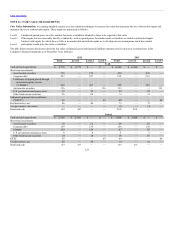
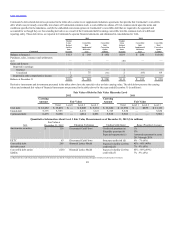
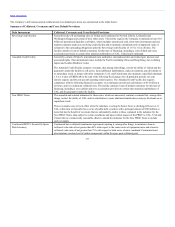
(b) Represents the illiquidity premium component of the discount rate that the Company has determined market participants would use in pricing the investments.
(c) Represents the estimated timing of principal repayments used in the discounted cash flow model.
(d) Represents the credit risk premium of the EETC structure above the risk-free rate that the Company has determined market participants would use in pricing the instruments.
(e) Represents the range in volatility estimates that the Company has determined market participants would use when pricing the instruments.
(f) Represents the range of Company-specific risk adjustments that the Company has determined market participants would use as a model input.
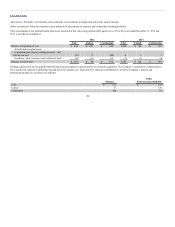
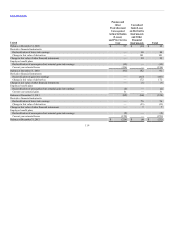
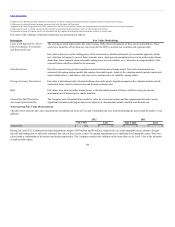
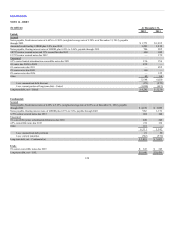
Fair value of the Company’s financial instruments was determined as follows:
The carrying amounts approximate fair value because of the short-term maturity of these assets and liabilities. These
assets have maturities of less than one year except for the EETCs, auction rate securities and corporate debt.
Fair value is based on (a) the trading prices of the investment or similar instruments, (b) an income approach, which
uses valuation techniques to convert future amounts into a single present amount based on current market expectations
about those future amounts when observable trading prices are not available, or (c) internally-developed models of the
expected future cash flows related to the securities.
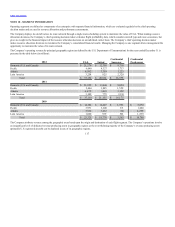
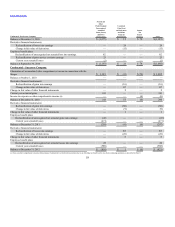
Derivative contracts are privately negotiated contracts and are not exchange traded. Fair value measurements are
estimated with option pricing models that employ observable inputs. Inputs to the valuation models include contractual
terms, market prices, yield curves, fuel price curves and measures of volatility, among others.
Fair value is determined with a formula utilizing observable inputs. Significant inputs to the valuation models include
contractual terms, risk-free interest rates and forward exchange rates.
Fair values were based on either market prices or the discounted amount of future cash flows using our current
incremental rate of borrowing for similar liabilities.
The Company used a binomial lattice model to value the conversion options and the supplemental derivative assets.
Significant binomial model inputs that are not objectively determinable include volatility and discount rate.
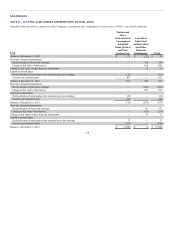
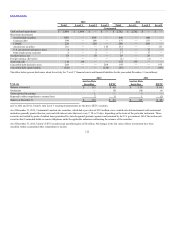
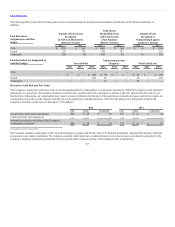
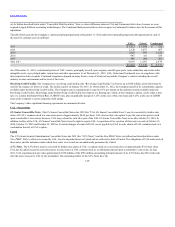
Nonrecurring Fair Value Measurements
The table below presents fair value measurements of nonfinancial assets at UAL and Continental that were performed during the years ended December 31 (in
millions):
Airport slots $102 $30 $ 8 $4
During 2012 and 2011, Continental recorded impairment charges of $30 million and $4 million, respectively, on certain intangible assets related to foreign
take-off and landing slots to reflect the estimated fair value of these assets as part of its annual impairment test of indefinite-lived intangible assets. Slots were
valued using a combination of the income and market approaches. The Company considers the valuation of the items above to be Level 3 due to the inclusion
of unobservable inputs.
124