United Airlines 2012 Annual Report Download - page 59
Download and view the complete annual report
Please find page 59 of the 2012 United Airlines annual report below. You can navigate through the pages in the report by either clicking on the pages listed below, or by using the keyword search tool below to find specific information within the annual report.-
 1
1 -
2
-
3
-
4
-
5
-
6
-
7
-
8
-
9
-
10
-
11
-
12
-
13
-
14
-
15
-
16
-
17
-
18
-
19
-
20
-
21
-
22
-
23
-
24
-
25
-
26
-
27
-
28
-
29
-
30
-
31
-
32
-
33
-
34
-
35
-
36
-
37
-
38
-
39
-
40
-
41
-
42
-
43
-
44
-
45
-
46
-
47
-
48
-
 49
49 -
 50
50 -
 51
51 -
 52
52 -
 53
53 -
 54
54 -
 55
55 -
 56
56 -
 57
57 -
 58
58 -
 59
59 -
 60
60 -
 61
61 -
 62
62 -
 63
63 -
 64
64 -
 65
65 -
 66
66 -
 67
67 -
 68
68 -
 69
69 -
70
-
71
-
72
-
73
-
74
-
75
-
76
-
77
-
78
-
79
-
80
-
81
-
82
-
83
-
84
-
85
-
86
-
87
-
88
-
89
-
90
-
91
-
92
-
93
-
94
-
95
-
96
-
97
-
98
-
99
-
100
-
101
-
102
-
103
-
104
-
105
-
106
-
107
-
108
-
109
-
110
-
111
-
112
-
113
-
114
-
115
-
116
-
117
-
118
-
119
-
120
-
121
-
122
-
123
-
124
-
125
-
126
-
127
-
128
-
129
-
130
-
131
-
132
-
133
-
134
-
135
-
136
-
137
-
138
-
139
-
140
-
141
-
142
-
143
-
144
-
145
-
146
-
147
-
148
-
149
-
150
-
151
-
152
-
153
-
154
-
155
-
156
-
157
-
158
-
159
-
160
-
161
-
162
-
163
-
164
-
165
-
166
-
167
-
168
-
169
-
170
-
171
-
172
-
173
-
174
-
175
-
176
-
177
-
178
-
179
-
180
-
181
-
182
-
183
-
184
-
185
-
186
-
187
-
188
-
189
-
190
-
191
-
192
-
193
-
194
-
195
-
196
-
197
-
198
-
199
-
200
-
201
-
202
-
203
-
204
-
205
-
206
-
207
-
208
-
209
-
210
-
211
-
212
-
213
-
214
-
215
-
216
-
217
-
218
-
219
-
220
-
221
-
222
-
223
-
224
-
225
-
226
-
227
-
228
-
229
-
230
-
231
-
232
-
233
-
234
-
235
-
236
-
237
-
238
-
239
-
240
-
241
-
242
-
243
-
244
-
245
-
246
-
247
-
248
-
249
-
250
-
251
-
252
-
253
-
254
-
255
-
256
-
257
-
258
-
259
-
260
-
261
-
262
-
263
-
264
-
265
-
266
-
267
-
268
-
269
-
270
-
271
-
272
-
273
-
274
-
275
-
276
-
277
-
278
-
279
-
280
-
281
-
282
-
283
-
284
-
285
-
286
-
287
-
288
-
289
-
290
-
291
-
292
-
293
-
294
-
295
-
296
-
297
-
298
-
299
-
300
-
301
-
302
-
303
-
304
-
305
-
306
-
307
-
308
-
309
-
310
-
311
-
312
-
313
-
314
-
315
-
316
-
317
-
318
-
319
-
320
-
321
-
322
-
323
-
324
-
325
-
326
-
327
-
328
-
329
-
330
-
331
-
332
-
333
-
334
-
335
-
336
-
337
-
338
-
339
-
340
-
341
-
342
-
343
-
344
-
345
-
346
-
347
-
348
-
349
-
350
-
351
-
352
-
353
-
354
-
355
-
356
-
357
-
358
-
359
-
360
-
361
-
362
-
363
-
364
-
365
-
366
-
367
-
368
-
369
-
370
-
371
-
372
-
373
-
374
-
375
-
376
-
377
-
378
-
379
-
380
-
381
-
382
-
383
-
384
-
385
-
386
-
387
-
388
-
389
-
390
-
391
-
392
-
393
-
394
-
395
-
396
-
397
-
398
-
399
-
400
-
401
-
402
-
403
-
404
-
405
-
406
-
407
-
408
-
409
-
410
-
411
-
412
-
413
-
414
-
415
-
416
-
417
-
418
-
419
-
420
-
421
-
422
-
423
-
424
-
425
-
426
-
427
-
428
-
429
-
430
-
431
-
432
-
433
-
434
-
435
-
436
-
437
-
438
-
439
-
440
-
441
-
442
-
443
-
444
-
445
-
446
-
447
-
448
-
449
-
450
-
451
-
452
-
453
-
454
-
455
-
456
-
457
-
458
-
459
-
460
-
461
 |
 |

Table of Contents
Goodwill is measured for impairment by initially comparing the fair value of the reporting unit to its carrying value, including goodwill. If the fair value of the
reporting unit is less than the carrying value, a second step is performed to determine the implied fair value of goodwill. If the implied fair value of goodwill is
lower than its carrying value, an impairment charge equal to the difference is recorded.
The Company has one consolidated reporting unit. In 2012, the Company estimated the fair value of the consolidated reporting unit using both an income and
a market approach. The income approach computes fair value by discounting future cash flows of the business and is dependent on a number of critical
management assumptions including estimates of future capacity, passenger yield, traffic, operating costs (including fuel prices), appropriate discount rates
and other relevant assumptions. The market approach computes fair value by adding a control premium to the Company’s market capitalization. The
Company’s fair value exceeded its carrying value under both approaches, and no goodwill impairment was recorded in 2012.
The Company is also required to assess the goodwill recorded on the separate financial statements of Continental for impairment. The fair value of Continental
was determined by allocating a percentage of the fair value of the consolidated Company (as determined and described in the paragraph above). The percentage
of the consolidated fair value allocated to Continental was based on a number of measures, including revenue share, available seat mile share, revenue
passenger mile share and passenger share. Based on these criteria, this resulted in a fair value allocation of such assets to United and Continental of 54% and
46%, respectively. The fair value of Continental exceeded its carrying value, and no goodwill impairment was recorded as of December 31, 2012.
The Company’s indefinite-lived intangible assets include certain international route authorities, take-off and landing slots at various airports, airline partner
alliances and the UAL trade name and logo. The fair values of the assets for purposes of the annual impairment test were determined using the market and
income approaches. The fair value measurements were primarily based on significant inputs that are not observable in the market. We utilized the market
approach to value certain intangible assets such as airport take-off and landing slots when sufficient market information was available. The income approach
was primarily used to value the international route authorities, airline partner alliances, the UAL trade name and logo, and certain airport take-off and landing
slots. The income approach indicates value for a subject asset based on the present value of cash flows projected to be generated by the asset. Projected cash
flows are discounted at a required market rate of return that reflects the relative risk of achieving the cash flows and the time value of money.
In most cases, these indefinite-lived assets are separately associated with and directly assignable to each separate subsidiary. Any impairment charges resulting
from the testing of the fair values of these indefinite-lived intangible assets are also assigned to the applicable separate subsidiary.
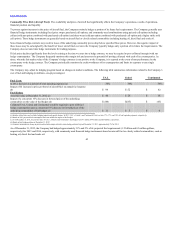
UAL recorded impairment charges for indefinite-lived intangible assets of $30 million, $4 million and $29 million during the years ended December 31,
2012, 2011 and 2010, respectively. During 2012 and 2011, Continental recorded impairment charges of $30 million and $4 million, respectively, on certain
intangible assets related to European take-off and landing slots to reflect the estimated fair value of these assets as part of its annual impairment test of
indefinite-lived intangible assets. In 2010, UAL recorded a $29 million impairment of its Brazil routes primarily due to the open skies agreement between the
United States and Brazil which may result in a decrease in revenue from these routes.
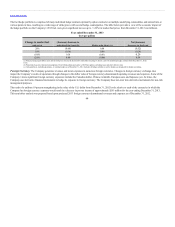
Long-Lived Assets. The net book value of operating property and equipment for UAL was $17.3 billion and $16.4 billion at December 31, 2012 and 2011,
respectively. The assets’ recorded value is impacted by a number of accounting policy elections, including the estimation of useful lives and residual values
and, when necessary, the recognition of asset impairment charges.
The Company records assets acquired, including aircraft, at acquisition cost. Depreciable life is determined through economic analysis, such as reviewing
existing fleet plans, obtaining appraisals and comparing estimated lives to other airlines that operate similar fleets. As aircraft technology has improved, useful
life has increased and the Company has generally estimated the lives of those aircraft to be 30 years. Residual values are estimated based on historical
experience with regard to the sale of both aircraft and spare parts and are established in
58