United Airlines 2012 Annual Report Download - page 42
Download and view the complete annual report
Please find page 42 of the 2012 United Airlines annual report below. You can navigate through the pages in the report by either clicking on the pages listed below, or by using the keyword search tool below to find specific information within the annual report.-
 1
1 -
2
-
3
-
4
-
5
-
6
-
7
-
8
-
9
-
10
-
11
-
12
-
13
-
14
-
15
-
16
-
17
-
18
-
19
-
20
-
21
-
22
-
23
-
24
-
25
-
26
-
27
-
28
-
29
-
30
-
31
-
 32
32 -
 33
33 -
 34
34 -
 35
35 -
 36
36 -
 37
37 -
 38
38 -
 39
39 -
 40
40 -
 41
41 -
 42
42 -
 43
43 -
 44
44 -
 45
45 -
 46
46 -
 47
47 -
 48
48 -
 49
49 -
 50
50 -
 51
51 -
 52
52 -
53
-
54
-
55
-
56
-
57
-
58
-
59
-
60
-
61
-
62
-
63
-
64
-
65
-
66
-
67
-
68
-
69
-
70
-
71
-
72
-
73
-
74
-
75
-
76
-
77
-
78
-
79
-
80
-
81
-
82
-
83
-
84
-
85
-
86
-
87
-
88
-
89
-
90
-
91
-
92
-
93
-
94
-
95
-
96
-
97
-
98
-
99
-
100
-
101
-
102
-
103
-
104
-
105
-
106
-
107
-
108
-
109
-
110
-
111
-
112
-
113
-
114
-
115
-
116
-
117
-
118
-
119
-
120
-
121
-
122
-
123
-
124
-
125
-
126
-
127
-
128
-
129
-
130
-
131
-
132
-
133
-
134
-
135
-
136
-
137
-
138
-
139
-
140
-
141
-
142
-
143
-
144
-
145
-
146
-
147
-
148
-
149
-
150
-
151
-
152
-
153
-
154
-
155
-
156
-
157
-
158
-
159
-
160
-
161
-
162
-
163
-
164
-
165
-
166
-
167
-
168
-
169
-
170
-
171
-
172
-
173
-
174
-
175
-
176
-
177
-
178
-
179
-
180
-
181
-
182
-
183
-
184
-
185
-
186
-
187
-
188
-
189
-
190
-
191
-
192
-
193
-
194
-
195
-
196
-
197
-
198
-
199
-
200
-
201
-
202
-
203
-
204
-
205
-
206
-
207
-
208
-
209
-
210
-
211
-
212
-
213
-
214
-
215
-
216
-
217
-
218
-
219
-
220
-
221
-
222
-
223
-
224
-
225
-
226
-
227
-
228
-
229
-
230
-
231
-
232
-
233
-
234
-
235
-
236
-
237
-
238
-
239
-
240
-
241
-
242
-
243
-
244
-
245
-
246
-
247
-
248
-
249
-
250
-
251
-
252
-
253
-
254
-
255
-
256
-
257
-
258
-
259
-
260
-
261
-
262
-
263
-
264
-
265
-
266
-
267
-
268
-
269
-
270
-
271
-
272
-
273
-
274
-
275
-
276
-
277
-
278
-
279
-
280
-
281
-
282
-
283
-
284
-
285
-
286
-
287
-
288
-
289
-
290
-
291
-
292
-
293
-
294
-
295
-
296
-
297
-
298
-
299
-
300
-
301
-
302
-
303
-
304
-
305
-
306
-
307
-
308
-
309
-
310
-
311
-
312
-
313
-
314
-
315
-
316
-
317
-
318
-
319
-
320
-
321
-
322
-
323
-
324
-
325
-
326
-
327
-
328
-
329
-
330
-
331
-
332
-
333
-
334
-
335
-
336
-
337
-
338
-
339
-
340
-
341
-
342
-
343
-
344
-
345
-
346
-
347
-
348
-
349
-
350
-
351
-
352
-
353
-
354
-
355
-
356
-
357
-
358
-
359
-
360
-
361
-
362
-
363
-
364
-
365
-
366
-
367
-
368
-
369
-
370
-
371
-
372
-
373
-
374
-
375
-
376
-
377
-
378
-
379
-
380
-
381
-
382
-
383
-
384
-
385
-
386
-
387
-
388
-
389
-
390
-
391
-
392
-
393
-
394
-
395
-
396
-
397
-
398
-
399
-
400
-
401
-
402
-
403
-
404
-
405
-
406
-
407
-
408
-
409
-
410
-
411
-
412
-
413
-
414
-
415
-
416
-
417
-
418
-
419
-
420
-
421
-
422
-
423
-
424
-
425
-
426
-
427
-
428
-
429
-
430
-
431
-
432
-
433
-
434
-
435
-
436
-
437
-
438
-
439
-
440
-
441
-
442
-
443
-
444
-
445
-
446
-
447
-
448
-
449
-
450
-
451
-
452
-
453
-
454
-
455
-
456
-
457
-
458
-
459
-
460
-
461
 |
 |

Table of Contents
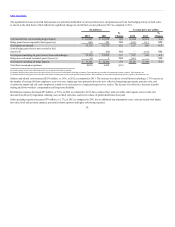
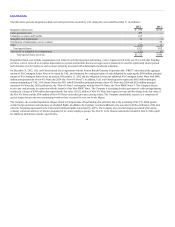
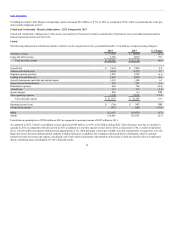
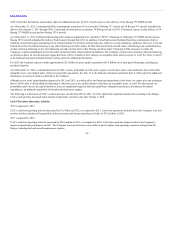
Nonoperating Income (Expense)
The following table illustrates the year-over-year dollar and percentage changes in UAL’s nonoperating income (expense) (in millions except percentage
changes):
Interest expense $(835) $(949) $ (114) (12.0)
Interest capitalized 37 32 5 15.6
Interest income 23 20 3 15.0
Miscellaneous, net 12 (80) 92 NM
Total $(763) $(977) $ (14) (1.4)
The decrease in interest expense of $114 million, or 12%, in 2012 as compared to 2011 was primarily due to lower average debt principal outstanding for a
majority of the year.
In 2012, miscellaneous, net included a fuel hedge ineffectiveness loss of $1 million primarily resulting from a decrease in fuel hedge ineffectiveness as
compared to a loss of $59 million in the year-ago period. Miscellaneous, net also included mark-to-market gains of $38 million from derivatives not
qualifying for hedge accounting as compared to zero in 2011.
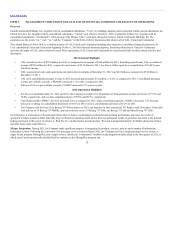
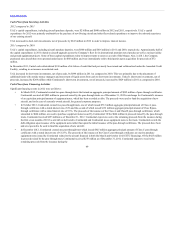
To provide a more meaningful comparison of UAL’s 2011 financial performance to 2010, we have quantified the increases relating to our operating results that
are due to Continental operations after the Merger closing date. The increases due to the Merger, presented in the tables below, represent Continental’s actual
results for the fourth quarter of 2010 and full year 2011. The discussion of UAL’s results excludes the impact of Continental’s results. Intercompany
transactions in 2010 were immaterial.
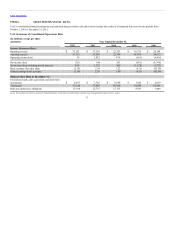
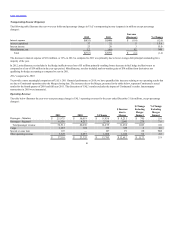
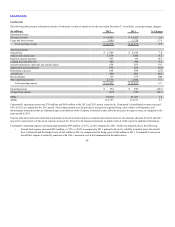
Operating Revenue
The table below illustrates the year-over-year percentage change in UAL’s operating revenues for the years ended December 31 (in millions, except percentage
changes):
Passenger—Mainline $ 25,975 $ 16,019 $ 9,956 $ 9,211 $ 745 5.6
Passenger—Regional 6,536 4,217 2,319 2,041 278 7.6
Total passenger revenue 32,511 20,236 12,275 11,252 1,023 6.0
Cargo 1,167 832 335 329 6 0.8
Special revenue item 107 — 107 19 88 NM
Other operating revenue 3,325 2,257 1,068 1,012 56 2.8
$ 37,110 $ 23,325 $ 13,785 $12,612 $ 1,173 5.9
41