United Airlines 2012 Annual Report Download - page 63
Download and view the complete annual report
Please find page 63 of the 2012 United Airlines annual report below. You can navigate through the pages in the report by either clicking on the pages listed below, or by using the keyword search tool below to find specific information within the annual report.-
 1
1 -
2
-
3
-
4
-
5
-
6
-
7
-
8
-
9
-
10
-
11
-
12
-
13
-
14
-
15
-
16
-
17
-
18
-
19
-
20
-
21
-
22
-
23
-
24
-
25
-
26
-
27
-
28
-
29
-
30
-
31
-
32
-
33
-
34
-
35
-
36
-
37
-
38
-
39
-
40
-
41
-
42
-
43
-
44
-
45
-
46
-
47
-
48
-
49
-
50
-
51
-
52
-
 53
53 -
 54
54 -
 55
55 -
 56
56 -
 57
57 -
 58
58 -
 59
59 -
 60
60 -
 61
61 -
 62
62 -
 63
63 -
 64
64 -
 65
65 -
 66
66 -
 67
67 -
 68
68 -
 69
69 -
 70
70 -
 71
71 -
 72
72 -
 73
73 -
74
-
75
-
76
-
77
-
78
-
79
-
80
-
81
-
82
-
83
-
84
-
85
-
86
-
87
-
88
-
89
-
90
-
91
-
92
-
93
-
94
-
95
-
96
-
97
-
98
-
99
-
100
-
101
-
102
-
103
-
104
-
105
-
106
-
107
-
108
-
109
-
110
-
111
-
112
-
113
-
114
-
115
-
116
-
117
-
118
-
119
-
120
-
121
-
122
-
123
-
124
-
125
-
126
-
127
-
128
-
129
-
130
-
131
-
132
-
133
-
134
-
135
-
136
-
137
-
138
-
139
-
140
-
141
-
142
-
143
-
144
-
145
-
146
-
147
-
148
-
149
-
150
-
151
-
152
-
153
-
154
-
155
-
156
-
157
-
158
-
159
-
160
-
161
-
162
-
163
-
164
-
165
-
166
-
167
-
168
-
169
-
170
-
171
-
172
-
173
-
174
-
175
-
176
-
177
-
178
-
179
-
180
-
181
-
182
-
183
-
184
-
185
-
186
-
187
-
188
-
189
-
190
-
191
-
192
-
193
-
194
-
195
-
196
-
197
-
198
-
199
-
200
-
201
-
202
-
203
-
204
-
205
-
206
-
207
-
208
-
209
-
210
-
211
-
212
-
213
-
214
-
215
-
216
-
217
-
218
-
219
-
220
-
221
-
222
-
223
-
224
-
225
-
226
-
227
-
228
-
229
-
230
-
231
-
232
-
233
-
234
-
235
-
236
-
237
-
238
-
239
-
240
-
241
-
242
-
243
-
244
-
245
-
246
-
247
-
248
-
249
-
250
-
251
-
252
-
253
-
254
-
255
-
256
-
257
-
258
-
259
-
260
-
261
-
262
-
263
-
264
-
265
-
266
-
267
-
268
-
269
-
270
-
271
-
272
-
273
-
274
-
275
-
276
-
277
-
278
-
279
-
280
-
281
-
282
-
283
-
284
-
285
-
286
-
287
-
288
-
289
-
290
-
291
-
292
-
293
-
294
-
295
-
296
-
297
-
298
-
299
-
300
-
301
-
302
-
303
-
304
-
305
-
306
-
307
-
308
-
309
-
310
-
311
-
312
-
313
-
314
-
315
-
316
-
317
-
318
-
319
-
320
-
321
-
322
-
323
-
324
-
325
-
326
-
327
-
328
-
329
-
330
-
331
-
332
-
333
-
334
-
335
-
336
-
337
-
338
-
339
-
340
-
341
-
342
-
343
-
344
-
345
-
346
-
347
-
348
-
349
-
350
-
351
-
352
-
353
-
354
-
355
-
356
-
357
-
358
-
359
-
360
-
361
-
362
-
363
-
364
-
365
-
366
-
367
-
368
-
369
-
370
-
371
-
372
-
373
-
374
-
375
-
376
-
377
-
378
-
379
-
380
-
381
-
382
-
383
-
384
-
385
-
386
-
387
-
388
-
389
-
390
-
391
-
392
-
393
-
394
-
395
-
396
-
397
-
398
-
399
-
400
-
401
-
402
-
403
-
404
-
405
-
406
-
407
-
408
-
409
-
410
-
411
-
412
-
413
-
414
-
415
-
416
-
417
-
418
-
419
-
420
-
421
-
422
-
423
-
424
-
425
-
426
-
427
-
428
-
429
-
430
-
431
-
432
-
433
-
434
-
435
-
436
-
437
-
438
-
439
-
440
-
441
-
442
-
443
-
444
-
445
-
446
-
447
-
448
-
449
-
450
-
451
-
452
-
453
-
454
-
455
-
456
-
457
-
458
-
459
-
460
-
461
 |
 |

Table of Contents
that global economic conditions have on customer travel patterns; excessive taxation and the inability to offset future taxable income; general economic
conditions (including interest rates, foreign currency exchange rates, investment or credit market conditions, crude oil prices, costs of aircraft fuel and energy
refining capacity in relevant markets); its ability to cost-effectively hedge against increases in the price of aircraft fuel; any potential realized or unrealized
gains or losses related to fuel or currency hedging programs; the effects of any hostilities, act of war or terrorist attack; the ability of other air carriers with
whom the Company has alliances or partnerships to provide the services contemplated by the respective arrangements with such carriers; the costs and
availability of aviation and other insurance; industry consolidation or changes in airline alliances; competitive pressures on pricing and demand; its capacity
decisions and the capacity decisions of its competitors; U.S. or foreign governmental legislation, regulation and other actions; labor costs; its ability to
maintain satisfactory labor relations and the results of the collective bargaining agreement process with its union groups; any disruptions to operations due to
any potential actions by its labor groups; weather conditions; the possibility that expected Merger synergies will not be realized or will not be realized within the
expected time period; and other risks and uncertainties set forth under Item 1A, , of this report, as well as other risks and uncertainties set forth
from time to time in the reports the Company files with the SEC.
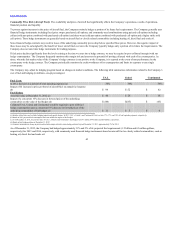
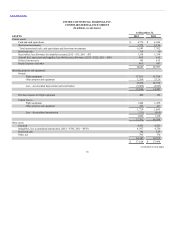
Our net income (loss) is affected by fluctuations in interest rates (e.g. interest expense on variable-rate debt and interest income earned on
short-term investments). The Company’s policy is to manage interest rate risk through a combination of fixed and variable rate debt. The following table
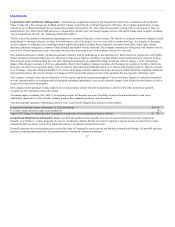
summarizes information related to the Company’s interest rate market risk at December 31 (in millions):
Carrying value of variable rate debt at
December 31
$ 2,869
$1,907
$962
$ 3,280
$2,109
$ 1,171
Impact of 100 basis point increase on
projected interest expense for the
following year
25
18
7
31
20
11
Carrying value of fixed rate debt at
December 31
9,383
3,468
5,513
8,402
3,636
4,357
Fair value of fixed rate debt at
December 31
10,569
3,710
5,900
8,996
3,717
4,420
Impact of 100 basis point increase in
market rates on fair value
(349)
(132)
(216)
(272)
(110)
(159)
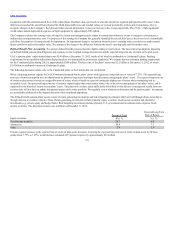
A change in market interest rates would also impact interest income earned on our cash, cash equivalents and short-term investments. Assuming our cash,
cash equivalents and short-term investments remain at their average 2012 levels, a 100 basis point increase in interest rates would result in a corresponding
increase in UAL, United and Continental interest income of approximately $74 million, $43 million and $31 million, respectively, during 2013.
62