United Airlines 2012 Annual Report Download - page 113
Download and view the complete annual report
Please find page 113 of the 2012 United Airlines annual report below. You can navigate through the pages in the report by either clicking on the pages listed below, or by using the keyword search tool below to find specific information within the annual report.-
 1
1 -
2
-
3
-
4
-
5
-
6
-
7
-
8
-
9
-
10
-
11
-
12
-
13
-
14
-
15
-
16
-
17
-
18
-
19
-
20
-
21
-
22
-
23
-
24
-
25
-
26
-
27
-
28
-
29
-
30
-
31
-
32
-
33
-
34
-
35
-
36
-
37
-
38
-
39
-
40
-
41
-
42
-
43
-
44
-
45
-
46
-
47
-
48
-
49
-
50
-
51
-
52
-
53
-
54
-
55
-
56
-
57
-
58
-
59
-
60
-
61
-
62
-
63
-
64
-
65
-
66
-
67
-
68
-
69
-
70
-
71
-
72
-
73
-
74
-
75
-
76
-
77
-
78
-
79
-
80
-
81
-
82
-
83
-
84
-
85
-
86
-
87
-
88
-
89
-
90
-
91
-
92
-
93
-
94
-
95
-
96
-
97
-
98
-
99
-
100
-
101
-
102
-
 103
103 -
 104
104 -
 105
105 -
 106
106 -
 107
107 -
 108
108 -
 109
109 -
 110
110 -
 111
111 -
 112
112 -
 113
113 -
 114
114 -
 115
115 -
 116
116 -
 117
117 -
 118
118 -
 119
119 -
 120
120 -
 121
121 -
 122
122 -
 123
123 -
124
-
125
-
126
-
127
-
128
-
129
-
130
-
131
-
132
-
133
-
134
-
135
-
136
-
137
-
138
-
139
-
140
-
141
-
142
-
143
-
144
-
145
-
146
-
147
-
148
-
149
-
150
-
151
-
152
-
153
-
154
-
155
-
156
-
157
-
158
-
159
-
160
-
161
-
162
-
163
-
164
-
165
-
166
-
167
-
168
-
169
-
170
-
171
-
172
-
173
-
174
-
175
-
176
-
177
-
178
-
179
-
180
-
181
-
182
-
183
-
184
-
185
-
186
-
187
-
188
-
189
-
190
-
191
-
192
-
193
-
194
-
195
-
196
-
197
-
198
-
199
-
200
-
201
-
202
-
203
-
204
-
205
-
206
-
207
-
208
-
209
-
210
-
211
-
212
-
213
-
214
-
215
-
216
-
217
-
218
-
219
-
220
-
221
-
222
-
223
-
224
-
225
-
226
-
227
-
228
-
229
-
230
-
231
-
232
-
233
-
234
-
235
-
236
-
237
-
238
-
239
-
240
-
241
-
242
-
243
-
244
-
245
-
246
-
247
-
248
-
249
-
250
-
251
-
252
-
253
-
254
-
255
-
256
-
257
-
258
-
259
-
260
-
261
-
262
-
263
-
264
-
265
-
266
-
267
-
268
-
269
-
270
-
271
-
272
-
273
-
274
-
275
-
276
-
277
-
278
-
279
-
280
-
281
-
282
-
283
-
284
-
285
-
286
-
287
-
288
-
289
-
290
-
291
-
292
-
293
-
294
-
295
-
296
-
297
-
298
-
299
-
300
-
301
-
302
-
303
-
304
-
305
-
306
-
307
-
308
-
309
-
310
-
311
-
312
-
313
-
314
-
315
-
316
-
317
-
318
-
319
-
320
-
321
-
322
-
323
-
324
-
325
-
326
-
327
-
328
-
329
-
330
-
331
-
332
-
333
-
334
-
335
-
336
-
337
-
338
-
339
-
340
-
341
-
342
-
343
-
344
-
345
-
346
-
347
-
348
-
349
-
350
-
351
-
352
-
353
-
354
-
355
-
356
-
357
-
358
-
359
-
360
-
361
-
362
-
363
-
364
-
365
-
366
-
367
-
368
-
369
-
370
-
371
-
372
-
373
-
374
-
375
-
376
-
377
-
378
-
379
-
380
-
381
-
382
-
383
-
384
-
385
-
386
-
387
-
388
-
389
-
390
-
391
-
392
-
393
-
394
-
395
-
396
-
397
-
398
-
399
-
400
-
401
-
402
-
403
-
404
-
405
-
406
-
407
-
408
-
409
-
410
-
411
-
412
-
413
-
414
-
415
-
416
-
417
-
418
-
419
-
420
-
421
-
422
-
423
-
424
-
425
-
426
-
427
-
428
-
429
-
430
-
431
-
432
-
433
-
434
-
435
-
436
-
437
-
438
-
439
-
440
-
441
-
442
-
443
-
444
-
445
-
446
-
447
-
448
-
449
-
450
-
451
-
452
-
453
-
454
-
455
-
456
-
457
-
458
-
459
-
460
-
461
 |
 |

Table of Contents
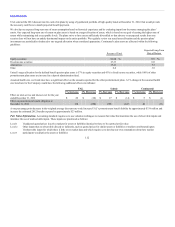
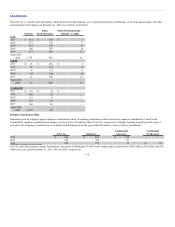
UAL selected the 2012 discount rate for each of its plans by using a hypothetical portfolio of high quality bonds at December 31, 2012, that would provide
the necessary cash flows to match projected benefit payments.
We develop our expected long-term rate of return assumption based on historical experience and by evaluating input from the trustee managing the plans’
assets.Our expected long-term rate of return on plan assets is based on a target allocation of assets, which is based on our goal of earning the highest rate of
return while maintaining risk at acceptable levels. The plans strive to have assets sufficiently diversified so that adverse or unexpected results from one
security class will not have an unduly detrimental impact on the entire portfolio. We regularly review our actual asset allocation and the pension plans’
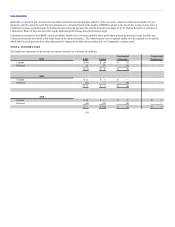
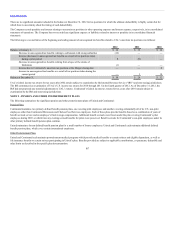
investments are periodically rebalanced to our targeted allocation when considered appropriate. Continental’s plan assets are allocated within the following
guidelines:
Percent of Total
Expected Long-Term
Rate of Return
Equity securities 38-54 % 9.5 %
Fixed-income securities 27-33 6.0
Alternatives 17-23 7.3
Other 2-6 3.8
United’s target allocation for the defined benefit pension plan assets is 57% in equity securities and 43% in fixed income securities, while 100% of other
postretirement plan assets are invested in a deposit administration fund.
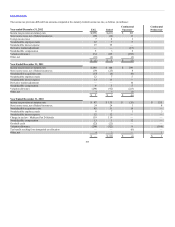
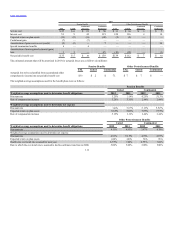
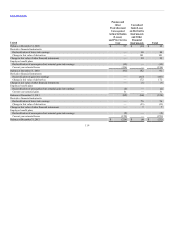
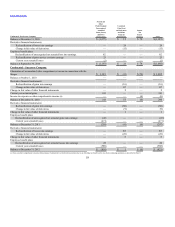
Assumed health care cost trend rates have a significant effect on the amounts reported for the other postretirement plans. A 1% change in the assumed health
care trend rate for the Company would have the following additional effects (in millions):
Effect on total service and interest cost for the year
ended December 31, 2012 $ 22 $ (18) $ 17 $ (14) $ 5 $ (4)
Effect on postretirement benefit obligation at
December 31, 2012 338 (280) 296 (247) 42 (33)
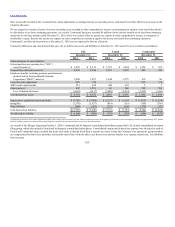
A one percentage point decrease in the weighted average discount rate would increase UAL’s postretirement benefit liability by approximately $336 million and
increase the estimated 2012 benefits expense by approximately $23 million.
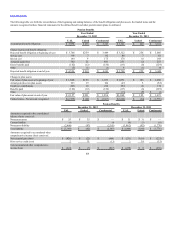
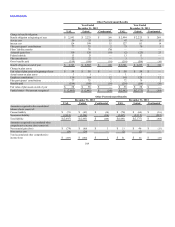
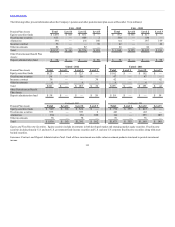
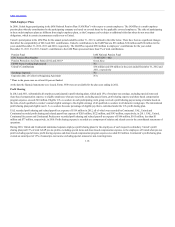
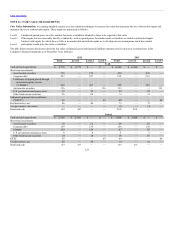
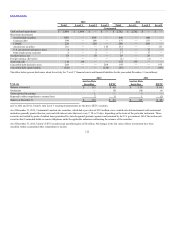
Fair Value Information. Accounting standards require us to use valuation techniques to measure fair value that maximize the use of observable inputs and
minimize the use of unobservable inputs. These inputs are prioritized as follows:
Level 1 Unadjusted quoted prices in active markets for assets or liabilities identical to those to be reported at fair value
Level 2 Other inputs that are observable directly or indirectly, such as quoted prices for similar assets or liabilities or market-corroborated inputs
Level 3
Unobservable inputs for which there is little or no market data and which require us to develop our own assumptions about how market
participants would price the assets or liabilities
112