United Airlines 2012 Annual Report Download - page 60
Download and view the complete annual report
Please find page 60 of the 2012 United Airlines annual report below. You can navigate through the pages in the report by either clicking on the pages listed below, or by using the keyword search tool below to find specific information within the annual report.-
 1
1 -
2
-
3
-
4
-
5
-
6
-
7
-
8
-
9
-
10
-
11
-
12
-
13
-
14
-
15
-
16
-
17
-
18
-
19
-
20
-
21
-
22
-
23
-
24
-
25
-
26
-
27
-
28
-
29
-
30
-
31
-
32
-
33
-
34
-
35
-
36
-
37
-
38
-
39
-
40
-
41
-
42
-
43
-
44
-
45
-
46
-
47
-
48
-
49
-
 50
50 -
 51
51 -
 52
52 -
 53
53 -
 54
54 -
 55
55 -
 56
56 -
 57
57 -
 58
58 -
 59
59 -
 60
60 -
 61
61 -
 62
62 -
 63
63 -
 64
64 -
 65
65 -
 66
66 -
 67
67 -
 68
68 -
 69
69 -
 70
70 -
71
-
72
-
73
-
74
-
75
-
76
-
77
-
78
-
79
-
80
-
81
-
82
-
83
-
84
-
85
-
86
-
87
-
88
-
89
-
90
-
91
-
92
-
93
-
94
-
95
-
96
-
97
-
98
-
99
-
100
-
101
-
102
-
103
-
104
-
105
-
106
-
107
-
108
-
109
-
110
-
111
-
112
-
113
-
114
-
115
-
116
-
117
-
118
-
119
-
120
-
121
-
122
-
123
-
124
-
125
-
126
-
127
-
128
-
129
-
130
-
131
-
132
-
133
-
134
-
135
-
136
-
137
-
138
-
139
-
140
-
141
-
142
-
143
-
144
-
145
-
146
-
147
-
148
-
149
-
150
-
151
-
152
-
153
-
154
-
155
-
156
-
157
-
158
-
159
-
160
-
161
-
162
-
163
-
164
-
165
-
166
-
167
-
168
-
169
-
170
-
171
-
172
-
173
-
174
-
175
-
176
-
177
-
178
-
179
-
180
-
181
-
182
-
183
-
184
-
185
-
186
-
187
-
188
-
189
-
190
-
191
-
192
-
193
-
194
-
195
-
196
-
197
-
198
-
199
-
200
-
201
-
202
-
203
-
204
-
205
-
206
-
207
-
208
-
209
-
210
-
211
-
212
-
213
-
214
-
215
-
216
-
217
-
218
-
219
-
220
-
221
-
222
-
223
-
224
-
225
-
226
-
227
-
228
-
229
-
230
-
231
-
232
-
233
-
234
-
235
-
236
-
237
-
238
-
239
-
240
-
241
-
242
-
243
-
244
-
245
-
246
-
247
-
248
-
249
-
250
-
251
-
252
-
253
-
254
-
255
-
256
-
257
-
258
-
259
-
260
-
261
-
262
-
263
-
264
-
265
-
266
-
267
-
268
-
269
-
270
-
271
-
272
-
273
-
274
-
275
-
276
-
277
-
278
-
279
-
280
-
281
-
282
-
283
-
284
-
285
-
286
-
287
-
288
-
289
-
290
-
291
-
292
-
293
-
294
-
295
-
296
-
297
-
298
-
299
-
300
-
301
-
302
-
303
-
304
-
305
-
306
-
307
-
308
-
309
-
310
-
311
-
312
-
313
-
314
-
315
-
316
-
317
-
318
-
319
-
320
-
321
-
322
-
323
-
324
-
325
-
326
-
327
-
328
-
329
-
330
-
331
-
332
-
333
-
334
-
335
-
336
-
337
-
338
-
339
-
340
-
341
-
342
-
343
-
344
-
345
-
346
-
347
-
348
-
349
-
350
-
351
-
352
-
353
-
354
-
355
-
356
-
357
-
358
-
359
-
360
-
361
-
362
-
363
-
364
-
365
-
366
-
367
-
368
-
369
-
370
-
371
-
372
-
373
-
374
-
375
-
376
-
377
-
378
-
379
-
380
-
381
-
382
-
383
-
384
-
385
-
386
-
387
-
388
-
389
-
390
-
391
-
392
-
393
-
394
-
395
-
396
-
397
-
398
-
399
-
400
-
401
-
402
-
403
-
404
-
405
-
406
-
407
-
408
-
409
-
410
-
411
-
412
-
413
-
414
-
415
-
416
-
417
-
418
-
419
-
420
-
421
-
422
-
423
-
424
-
425
-
426
-
427
-
428
-
429
-
430
-
431
-
432
-
433
-
434
-
435
-
436
-
437
-
438
-
439
-
440
-
441
-
442
-
443
-
444
-
445
-
446
-
447
-
448
-
449
-
450
-
451
-
452
-
453
-
454
-
455
-
456
-
457
-
458
-
459
-
460
-
461
 |
 |

Table of Contents
conjunction with the estimated useful lives of the related fleets. Residual values are based on when the aircraft are acquired and typically reflect asset values
that have not reached the end of their physical life. Both depreciable lives and residual values are revised periodically as facts and circumstances arise to
recognize changes in the Company’s fleet plan and other relevant information. A one-year increase in the average depreciable life of UAL’s flight equipment
would reduce annual depreciation expense on flight equipment by approximately $50 million.
The Company evaluates the carrying value of long-lived assets and intangible assets subject to amortization whenever events or changes in circumstances
indicate that an impairment may exist. For purposes of this testing, the Company has generally identified the aircraft fleet type as the lowest level of identifiable
cash flows for purposes of testing aircraft for impairment. An impairment charge is recognized when the asset’s carrying value exceeds its net undiscounted
future cash flows and its fair market value. The amount of the charge is the difference between the asset’s carrying value and fair market value.
Defined Benefit Plan Accounting. We sponsor defined benefit pension plans for eligible employees and retirees. The most critical assumptions impacting
our defined benefit pension plan obligations and expenses are the weighted average discount rate and the expected long-term rate of return on the plan assets.
UAL’s pension plans’ under-funded status was $2.4 billion at December 31, 2012, nearly all of which is attributable to Continental’s plans. Funding
requirements for tax-qualified defined benefit pension plans are determined by government regulations. We estimate that our minimum funding requirements
for the Continental plans during 2012 is approximately $200 million. The fair value of the plans’ assets was $2.2 billion at December 31, 2012, of which
$1.9 billion is attributed to assets of Continental’s plans.
The following discussion relates only to the Continental plans, as the United plans are not material.
When calculating pension expense for 2013, Continental assumed that its plans’ assets would generate a long-term rate of return of 7.75%. The expected long-
term rate of return assumption was developed based on historical experience and input from the trustee managing the plans’ assets. The expected long-term rate
of return on plan assets is based on a target allocation of assets, which is based on a goal of earning the highest rate of return while maintaining risk at
acceptable levels. Our projected long-term rate of return is slightly higher than some market indices due to the active management of our plans’ assets, and is
supported by the historical returns on our plans’ assets. The plans strive to have assets sufficiently diversified so that adverse or unexpected results from one
security class will not have an unduly detrimental impact on the entire portfolio. We regularly review actual asset allocation and the pension plans’ investments
are periodically rebalanced to the targeted allocation when considered appropriate.
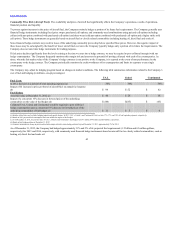
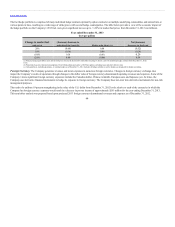
The defined benefit pension plans’ assets consist of return generating investments and risk mitigating investments which are held through direct ownership or
through interests in common collective trusts. Return generating investments include primarily equity securities, fixed-income securities and alternative
investments (e.g. private equity and hedge funds). Risk mitigating investments include primarily U.S. government and investment grade corporate fixed-
income securities. The allocation of assets was as follows at December 31, 2012:
Percent of Total
Expected Long-Term
Rate of Return
Equity securities 47.0 % 9.5 %
Fixed-income securities 28.7 6.0
Alternatives 20.4 7.3
Other 3.9 3.8
Pension expense increases as the expected rate of return on plan assets decreases. Lowering the expected long-term rate of return on plan assets by 50 basis
points (from 7.75% to 7.25%) would increase estimated 2013 pension expense by approximately $10 million.
59