United Airlines 2012 Annual Report Download - page 39
Download and view the complete annual report
Please find page 39 of the 2012 United Airlines annual report below. You can navigate through the pages in the report by either clicking on the pages listed below, or by using the keyword search tool below to find specific information within the annual report.-
 1
1 -
2
-
3
-
4
-
5
-
6
-
7
-
8
-
9
-
10
-
11
-
12
-
13
-
14
-
15
-
16
-
17
-
18
-
19
-
20
-
21
-
22
-
23
-
24
-
25
-
26
-
27
-
28
-
 29
29 -
 30
30 -
 31
31 -
 32
32 -
 33
33 -
 34
34 -
 35
35 -
 36
36 -
 37
37 -
 38
38 -
 39
39 -
 40
40 -
 41
41 -
 42
42 -
 43
43 -
 44
44 -
 45
45 -
 46
46 -
 47
47 -
 48
48 -
 49
49 -
50
-
51
-
52
-
53
-
54
-
55
-
56
-
57
-
58
-
59
-
60
-
61
-
62
-
63
-
64
-
65
-
66
-
67
-
68
-
69
-
70
-
71
-
72
-
73
-
74
-
75
-
76
-
77
-
78
-
79
-
80
-
81
-
82
-
83
-
84
-
85
-
86
-
87
-
88
-
89
-
90
-
91
-
92
-
93
-
94
-
95
-
96
-
97
-
98
-
99
-
100
-
101
-
102
-
103
-
104
-
105
-
106
-
107
-
108
-
109
-
110
-
111
-
112
-
113
-
114
-
115
-
116
-
117
-
118
-
119
-
120
-
121
-
122
-
123
-
124
-
125
-
126
-
127
-
128
-
129
-
130
-
131
-
132
-
133
-
134
-
135
-
136
-
137
-
138
-
139
-
140
-
141
-
142
-
143
-
144
-
145
-
146
-
147
-
148
-
149
-
150
-
151
-
152
-
153
-
154
-
155
-
156
-
157
-
158
-
159
-
160
-
161
-
162
-
163
-
164
-
165
-
166
-
167
-
168
-
169
-
170
-
171
-
172
-
173
-
174
-
175
-
176
-
177
-
178
-
179
-
180
-
181
-
182
-
183
-
184
-
185
-
186
-
187
-
188
-
189
-
190
-
191
-
192
-
193
-
194
-
195
-
196
-
197
-
198
-
199
-
200
-
201
-
202
-
203
-
204
-
205
-
206
-
207
-
208
-
209
-
210
-
211
-
212
-
213
-
214
-
215
-
216
-
217
-
218
-
219
-
220
-
221
-
222
-
223
-
224
-
225
-
226
-
227
-
228
-
229
-
230
-
231
-
232
-
233
-
234
-
235
-
236
-
237
-
238
-
239
-
240
-
241
-
242
-
243
-
244
-
245
-
246
-
247
-
248
-
249
-
250
-
251
-
252
-
253
-
254
-
255
-
256
-
257
-
258
-
259
-
260
-
261
-
262
-
263
-
264
-
265
-
266
-
267
-
268
-
269
-
270
-
271
-
272
-
273
-
274
-
275
-
276
-
277
-
278
-
279
-
280
-
281
-
282
-
283
-
284
-
285
-
286
-
287
-
288
-
289
-
290
-
291
-
292
-
293
-
294
-
295
-
296
-
297
-
298
-
299
-
300
-
301
-
302
-
303
-
304
-
305
-
306
-
307
-
308
-
309
-
310
-
311
-
312
-
313
-
314
-
315
-
316
-
317
-
318
-
319
-
320
-
321
-
322
-
323
-
324
-
325
-
326
-
327
-
328
-
329
-
330
-
331
-
332
-
333
-
334
-
335
-
336
-
337
-
338
-
339
-
340
-
341
-
342
-
343
-
344
-
345
-
346
-
347
-
348
-
349
-
350
-
351
-
352
-
353
-
354
-
355
-
356
-
357
-
358
-
359
-
360
-
361
-
362
-
363
-
364
-
365
-
366
-
367
-
368
-
369
-
370
-
371
-
372
-
373
-
374
-
375
-
376
-
377
-
378
-
379
-
380
-
381
-
382
-
383
-
384
-
385
-
386
-
387
-
388
-
389
-
390
-
391
-
392
-
393
-
394
-
395
-
396
-
397
-
398
-
399
-
400
-
401
-
402
-
403
-
404
-
405
-
406
-
407
-
408
-
409
-
410
-
411
-
412
-
413
-
414
-
415
-
416
-
417
-
418
-
419
-
420
-
421
-
422
-
423
-
424
-
425
-
426
-
427
-
428
-
429
-
430
-
431
-
432
-
433
-
434
-
435
-
436
-
437
-
438
-
439
-
440
-
441
-
442
-
443
-
444
-
445
-
446
-
447
-
448
-
449
-
450
-
451
-
452
-
453
-
454
-
455
-
456
-
457
-
458
-
459
-
460
-
461
 |
 |

Table of Contents
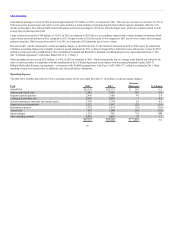
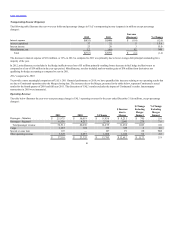
Consolidated passenger revenue in 2012 increased approximately $72 million, or 0.2%, as compared to 2011. This increase was due to an increase of 1.2% in
both average fare per passenger and yield, over the same period as a result of improved pricing primarily from industry capacity discipline, offset by a 1%
decline in passengers. The reduced traffic from both business and leisure passengers in 2012 was offset by higher fares, which drove improvements in both
average fare per passenger and yield.
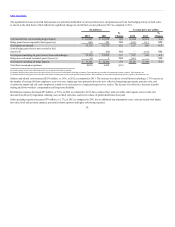
Cargo revenue decreased by $149 million, or 12.8%, in 2012 as compared to 2011 due to excess industry capacity and a weaker demand environment. Both
cargo volume and yield declined in 2012 compared to 2011. Freight revenue in 2012 decreased 13.4% compared to 2011 due to lower volume, fuel surcharges
and processing fees. Mail revenue decreased 8.1% in 2012 as compared to 2011 primarily due to lower volume.
Revenue in 2011 was also impacted by certain accounting changes, as described in Note 2 to the financial statements in Item 8 of this report. In conjunction
with these accounting changes, the Company recorded a special adjustment in 2011 to decrease frequent flyer deferred revenue and increase revenue by $107
million in connection with a modification to The Consolidated Amended and Restated Co-Branded Card Marketing Services Agreement dated June 9, 2011
(the “Co-Brand Agreement”) with Chase Bank USA, N.A. (“Chase”).
Other operating revenue was up $226 million, or 6.8%, in 2012 as compared to 2011, which was primarily due to a change in the deferral rate related to the
sales of credit card miles in conjunction with the modification of the Co-Brand Agreement in accordance with Accounting Standards Update 2009-13,
Multiple-Deliverable Revenue Arrangements - a consensus of the FASB Emerging Issues Task Force (“ASU 2009-13”), which was adopted in 2011. Other
operating revenue also increased due to additional sales of aircraft fuel to a third party.
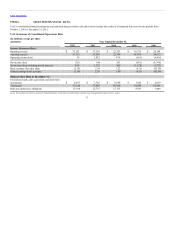
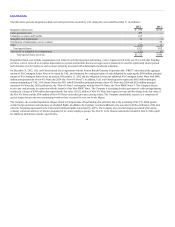
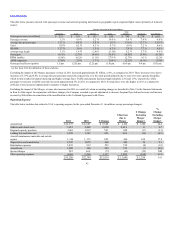
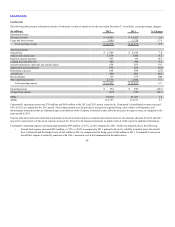
Operating Expense
The table below includes data related to UAL’s operating expense for the year ended December 31 (in millions, except percentage changes).
Aircraft fuel $13,138 $12,375 $ 763 6.2
Salaries and related costs 7,945 7,652 293 3.8
Regional capacity purchase 2,470 2,403 67 2.8
Landing fees and other rent 1,929 1,928 1 0.1
Aircraft maintenance materials and outside repairs 1,760 1,744 16 0.9
Depreciation and amortization 1,522 1,547 (25) (1.6)
Distribution expenses 1,352 1,435 (83) (5.8)
Aircraft rent 993 1,009 (16) (1.6)
Special charges 1,323 592 731 NM
Other operating expenses 4,681 4,603 78 1.7
$37,113 $35,288 $ 1,825 5.2
38