United Airlines 2012 Annual Report Download - page 441
Download and view the complete annual report
Please find page 441 of the 2012 United Airlines annual report below. You can navigate through the pages in the report by either clicking on the pages listed below, or by using the keyword search tool below to find specific information within the annual report.-
 1
1 -
2
-
3
-
4
-
5
-
6
-
7
-
8
-
9
-
10
-
11
-
12
-
13
-
14
-
15
-
16
-
17
-
18
-
19
-
20
-
21
-
22
-
23
-
24
-
25
-
26
-
27
-
28
-
29
-
30
-
31
-
32
-
33
-
34
-
35
-
36
-
37
-
38
-
39
-
40
-
41
-
42
-
43
-
44
-
45
-
46
-
47
-
48
-
49
-
50
-
51
-
52
-
53
-
54
-
55
-
56
-
57
-
58
-
59
-
60
-
61
-
62
-
63
-
64
-
65
-
66
-
67
-
68
-
69
-
70
-
71
-
72
-
73
-
74
-
75
-
76
-
77
-
78
-
79
-
80
-
81
-
82
-
83
-
84
-
85
-
86
-
87
-
88
-
89
-
90
-
91
-
92
-
93
-
94
-
95
-
96
-
97
-
98
-
99
-
100
-
101
-
102
-
103
-
104
-
105
-
106
-
107
-
108
-
109
-
110
-
111
-
112
-
113
-
114
-
115
-
116
-
117
-
118
-
119
-
120
-
121
-
122
-
123
-
124
-
125
-
126
-
127
-
128
-
129
-
130
-
131
-
132
-
133
-
134
-
135
-
136
-
137
-
138
-
139
-
140
-
141
-
142
-
143
-
144
-
145
-
146
-
147
-
148
-
149
-
150
-
151
-
152
-
153
-
154
-
155
-
156
-
157
-
158
-
159
-
160
-
161
-
162
-
163
-
164
-
165
-
166
-
167
-
168
-
169
-
170
-
171
-
172
-
173
-
174
-
175
-
176
-
177
-
178
-
179
-
180
-
181
-
182
-
183
-
184
-
185
-
186
-
187
-
188
-
189
-
190
-
191
-
192
-
193
-
194
-
195
-
196
-
197
-
198
-
199
-
200
-
201
-
202
-
203
-
204
-
205
-
206
-
207
-
208
-
209
-
210
-
211
-
212
-
213
-
214
-
215
-
216
-
217
-
218
-
219
-
220
-
221
-
222
-
223
-
224
-
225
-
226
-
227
-
228
-
229
-
230
-
231
-
232
-
233
-
234
-
235
-
236
-
237
-
238
-
239
-
240
-
241
-
242
-
243
-
244
-
245
-
246
-
247
-
248
-
249
-
250
-
251
-
252
-
253
-
254
-
255
-
256
-
257
-
258
-
259
-
260
-
261
-
262
-
263
-
264
-
265
-
266
-
267
-
268
-
269
-
270
-
271
-
272
-
273
-
274
-
275
-
276
-
277
-
278
-
279
-
280
-
281
-
282
-
283
-
284
-
285
-
286
-
287
-
288
-
289
-
290
-
291
-
292
-
293
-
294
-
295
-
296
-
297
-
298
-
299
-
300
-
301
-
302
-
303
-
304
-
305
-
306
-
307
-
308
-
309
-
310
-
311
-
312
-
313
-
314
-
315
-
316
-
317
-
318
-
319
-
320
-
321
-
322
-
323
-
324
-
325
-
326
-
327
-
328
-
329
-
330
-
331
-
332
-
333
-
334
-
335
-
336
-
337
-
338
-
339
-
340
-
341
-
342
-
343
-
344
-
345
-
346
-
347
-
348
-
349
-
350
-
351
-
352
-
353
-
354
-
355
-
356
-
357
-
358
-
359
-
360
-
361
-
362
-
363
-
364
-
365
-
366
-
367
-
368
-
369
-
370
-
371
-
372
-
373
-
374
-
375
-
376
-
377
-
378
-
379
-
380
-
381
-
382
-
383
-
384
-
385
-
386
-
387
-
388
-
389
-
390
-
391
-
392
-
393
-
394
-
395
-
396
-
397
-
398
-
399
-
400
-
401
-
402
-
403
-
404
-
405
-
406
-
407
-
408
-
409
-
410
-
411
-
412
-
413
-
414
-
415
-
416
-
417
-
418
-
419
-
420
-
421
-
422
-
423
-
424
-
425
-
426
-
427
-
428
-
429
-
430
-
 431
431 -
 432
432 -
 433
433 -
 434
434 -
 435
435 -
 436
436 -
 437
437 -
 438
438 -
 439
439 -
 440
440 -
 441
441 -
 442
442 -
 443
443 -
 444
444 -
 445
445 -
 446
446 -
 447
447 -
 448
448 -
 449
449 -
 450
450 -
 451
451 -
452
-
453
-
454
-
455
-
456
-
457
-
458
-
459
-
460
-
461
 |
 |

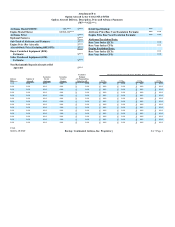
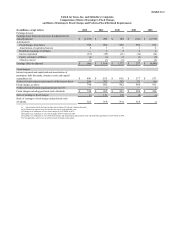
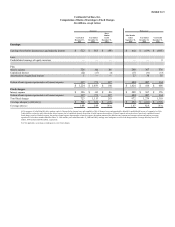
Exhibit 12.3
Continental Airlines, Inc.
Computation of Ratio of Earnings to Fixed Charges
(In millions, except ratios)
Successor Predecessor
Year Ended
December 31,
2012
Year Ended
December 31,
2011
Three
Months
Ended
December 31,
2010
Nine Months
Ended
September 30,
2010
Year Ended
December 31,
2009
Year Ended
December 31,
2008
Earnings:
Earnings (loss) before income taxes and minority interest $ 522 $ 563 $ (99) $ 442 $ (439) $ (695)
Less:
Undistributed earnings of equity investees — — — — — 9
Plus:
Interest expense 326 342 86 288 367 376
Capitalized interest (22) (17) (4) (17) (33) (33)
Amortization of capitalized interest 1 — — 27 36 35
Portion of rent expense representative of interest expense 397 771 197 684 907 934
$ 1,224 $ 1,659 $ 180 $ 1,424 $ 838 $ 608
Fixed charges:
Interest expense $ 326 $ 342 $ 86 $ 288 $ 367 $ 376
Portion of rent expense representative of interest expense 397 771 197 684 907 934
Total fixed charges 723 1,113 283 972 1,274 1,310
Coverage adequacy (deficiency) $ 501 $ 546 $ (103) $ 452 $ (436) $ (702)
Coverage ratio (a) 1.69 1.49 N/A 1.47 N/A N/A
(a) For purposes of calculating this ratio, earnings consist of income before income taxes and cumulative effect of changes in accounting principles adjusted for undistributed income of companies in which
Continental has a minority equity interest plus interest expense (net of capitalized interest), the portion of rental expense representative of interest expense and amortization of previously capitalized interest.
Fixed charges consist of interest expense, the portion of rental expense representative of interest expense, the amount amortized for debt discount, premium and issuance expense and interest previously
capitalized. For the three months ended December 31, 2010 and the years ended December 31, 2009 and 2008, earnings were inadequate to cover fixed charges and the coverage deficiency was $103
million, $436 million and $702 million, respectively.
N/A Not applicable, as earnings are inadequate to cover fixed charges.