United Airlines 2012 Annual Report Download - page 38
Download and view the complete annual report
Please find page 38 of the 2012 United Airlines annual report below. You can navigate through the pages in the report by either clicking on the pages listed below, or by using the keyword search tool below to find specific information within the annual report.-
 1
1 -
2
-
3
-
4
-
5
-
6
-
7
-
8
-
9
-
10
-
11
-
12
-
13
-
14
-
15
-
16
-
17
-
18
-
19
-
20
-
21
-
22
-
23
-
24
-
25
-
26
-
27
-
 28
28 -
 29
29 -
 30
30 -
 31
31 -
 32
32 -
 33
33 -
 34
34 -
 35
35 -
 36
36 -
 37
37 -
 38
38 -
 39
39 -
 40
40 -
 41
41 -
 42
42 -
 43
43 -
 44
44 -
 45
45 -
 46
46 -
 47
47 -
 48
48 -
49
-
50
-
51
-
52
-
53
-
54
-
55
-
56
-
57
-
58
-
59
-
60
-
61
-
62
-
63
-
64
-
65
-
66
-
67
-
68
-
69
-
70
-
71
-
72
-
73
-
74
-
75
-
76
-
77
-
78
-
79
-
80
-
81
-
82
-
83
-
84
-
85
-
86
-
87
-
88
-
89
-
90
-
91
-
92
-
93
-
94
-
95
-
96
-
97
-
98
-
99
-
100
-
101
-
102
-
103
-
104
-
105
-
106
-
107
-
108
-
109
-
110
-
111
-
112
-
113
-
114
-
115
-
116
-
117
-
118
-
119
-
120
-
121
-
122
-
123
-
124
-
125
-
126
-
127
-
128
-
129
-
130
-
131
-
132
-
133
-
134
-
135
-
136
-
137
-
138
-
139
-
140
-
141
-
142
-
143
-
144
-
145
-
146
-
147
-
148
-
149
-
150
-
151
-
152
-
153
-
154
-
155
-
156
-
157
-
158
-
159
-
160
-
161
-
162
-
163
-
164
-
165
-
166
-
167
-
168
-
169
-
170
-
171
-
172
-
173
-
174
-
175
-
176
-
177
-
178
-
179
-
180
-
181
-
182
-
183
-
184
-
185
-
186
-
187
-
188
-
189
-
190
-
191
-
192
-
193
-
194
-
195
-
196
-
197
-
198
-
199
-
200
-
201
-
202
-
203
-
204
-
205
-
206
-
207
-
208
-
209
-
210
-
211
-
212
-
213
-
214
-
215
-
216
-
217
-
218
-
219
-
220
-
221
-
222
-
223
-
224
-
225
-
226
-
227
-
228
-
229
-
230
-
231
-
232
-
233
-
234
-
235
-
236
-
237
-
238
-
239
-
240
-
241
-
242
-
243
-
244
-
245
-
246
-
247
-
248
-
249
-
250
-
251
-
252
-
253
-
254
-
255
-
256
-
257
-
258
-
259
-
260
-
261
-
262
-
263
-
264
-
265
-
266
-
267
-
268
-
269
-
270
-
271
-
272
-
273
-
274
-
275
-
276
-
277
-
278
-
279
-
280
-
281
-
282
-
283
-
284
-
285
-
286
-
287
-
288
-
289
-
290
-
291
-
292
-
293
-
294
-
295
-
296
-
297
-
298
-
299
-
300
-
301
-
302
-
303
-
304
-
305
-
306
-
307
-
308
-
309
-
310
-
311
-
312
-
313
-
314
-
315
-
316
-
317
-
318
-
319
-
320
-
321
-
322
-
323
-
324
-
325
-
326
-
327
-
328
-
329
-
330
-
331
-
332
-
333
-
334
-
335
-
336
-
337
-
338
-
339
-
340
-
341
-
342
-
343
-
344
-
345
-
346
-
347
-
348
-
349
-
350
-
351
-
352
-
353
-
354
-
355
-
356
-
357
-
358
-
359
-
360
-
361
-
362
-
363
-
364
-
365
-
366
-
367
-
368
-
369
-
370
-
371
-
372
-
373
-
374
-
375
-
376
-
377
-
378
-
379
-
380
-
381
-
382
-
383
-
384
-
385
-
386
-
387
-
388
-
389
-
390
-
391
-
392
-
393
-
394
-
395
-
396
-
397
-
398
-
399
-
400
-
401
-
402
-
403
-
404
-
405
-
406
-
407
-
408
-
409
-
410
-
411
-
412
-
413
-
414
-
415
-
416
-
417
-
418
-
419
-
420
-
421
-
422
-
423
-
424
-
425
-
426
-
427
-
428
-
429
-
430
-
431
-
432
-
433
-
434
-
435
-
436
-
437
-
438
-
439
-
440
-
441
-
442
-
443
-
444
-
445
-
446
-
447
-
448
-
449
-
450
-
451
-
452
-
453
-
454
-
455
-
456
-
457
-
458
-
459
-
460
-
461
 |
 |

Table of Contents
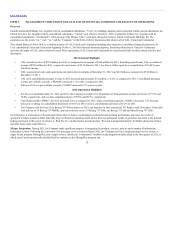
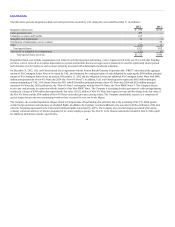
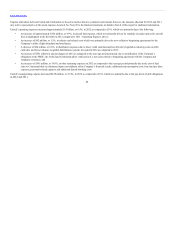
Labor Costs. As of December 31, 2012, the Company had approximately 80% of employees represented by unions. We are in the process of negotiating
amended collective bargaining agreements with our major employee groups. The Company cannot predict the outcome of negotiations with its unionized
employee groups, although significant increases in the pay and benefits resulting from new collective bargaining agreements would have an adverse financial
impact on the Company.
In 2013, the Company expects CASM, excluding fuel, profit sharing and third-party business expense to increase 4.5% to 5.5% year-over-year, of which
approximately 2.5 percentage points are due to collective bargaining agreements with various employee groups.
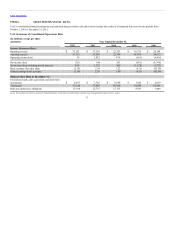
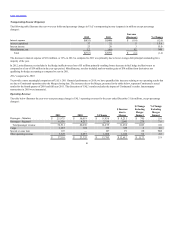
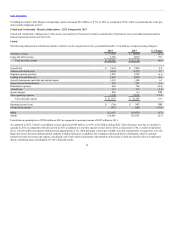
In this section, we compare UAL’s results of operations for the year ended December 31, 2012 with UAL’s results of operations for the year ended
December 31, 2011. This presentation differs from the comparison of 2011 and 2010 results, which compares UAL’s financial performance year-over-year
excluding the Merger impact in 2010, represented by Continental Successor results in the fourth quarter of 2010. Non-GAAP financial measures are presented
because they provide management and investors with the ability to measure and monitor UAL’s performance on a consistent basis.
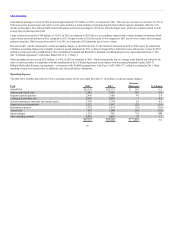
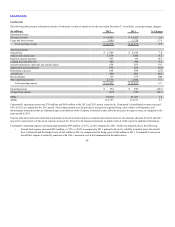
Operating Revenue
The table below illustrates the year-over-year percentage change in UAL’s operating revenues for the years ended December 31 (in millions, except percentage
changes):
Passenger—Mainline $25,804 $25,975 $ (171) (0.7)
Passenger—Regional 6,779 6,536 243 3.7
Total passenger revenue 32,583 32,511 72 0.2
Cargo 1,018 1,167 (149) (12.8)
Special revenue item — 107 (107) NM
Other operating revenue 3,551 3,325 226 6.8
$37,152 $ 37,110 $ 42 0.1
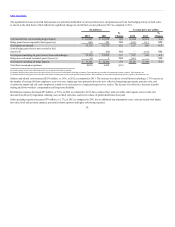
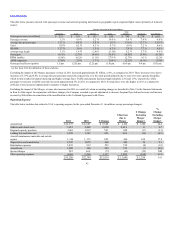
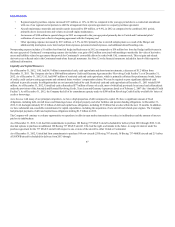
The table below presents UAL’s passenger revenues and operating data based on geographic region (regional flights consist primarily of domestic routes):
Passenger revenue (in millions) $ (338) $ 391 $(197) $(27) $(171) $243 $ 72
Passenger revenue (2.6)% 8.6% (3.4)% (1.0)% (0.7)% 3.7 % 0.2 %
Average fare per passenger 1.5 % 2.3% (0.1)% (1.5)% 2.3% 0.6 % 1.2 %
Yield (0.1)% 5.1% 0.3 % (4.2)% 0.6 % 2.5 % 1.2 %
PRASM (0.3)% 5.8% 0.2 % (2.2)% 0.8 % 5.5 % 1.7 %
Average stage length 2.3 % 1.6% 0.3 % 3.1 % 2.8 % (2.3)% 1.1 %
Passengers (4.0)% 6.1% (3.4)% 0.5 % (2.9)% 3.1 % (1.0)%
RPMs (traffic) (2.5)% 3.2% (3.7)% 3.2 % (1.3)% 1.2 % (1.0)%
ASMs (capacity) (2.4)% 2.7% (3.6)% 1.3 % (1.4)% (1.7)% (1.5)%
Passenger load factor (points) (0.2) 0.4 (0.2) 1.6 0.1 2.2 0.4
(a) See Item 6 for the definition of these statistics.
37