United Airlines 2012 Annual Report Download - page 33
Download and view the complete annual report
Please find page 33 of the 2012 United Airlines annual report below. You can navigate through the pages in the report by either clicking on the pages listed below, or by using the keyword search tool below to find specific information within the annual report.-
 1
1 -
2
-
3
-
4
-
5
-
6
-
7
-
8
-
9
-
10
-
11
-
12
-
13
-
14
-
15
-
16
-
17
-
18
-
19
-
20
-
21
-
22
-
 23
23 -
 24
24 -
 25
25 -
 26
26 -
 27
27 -
 28
28 -
 29
29 -
 30
30 -
 31
31 -
 32
32 -
 33
33 -
 34
34 -
 35
35 -
 36
36 -
 37
37 -
 38
38 -
 39
39 -
 40
40 -
 41
41 -
 42
42 -
 43
43 -
44
-
45
-
46
-
47
-
48
-
49
-
50
-
51
-
52
-
53
-
54
-
55
-
56
-
57
-
58
-
59
-
60
-
61
-
62
-
63
-
64
-
65
-
66
-
67
-
68
-
69
-
70
-
71
-
72
-
73
-
74
-
75
-
76
-
77
-
78
-
79
-
80
-
81
-
82
-
83
-
84
-
85
-
86
-
87
-
88
-
89
-
90
-
91
-
92
-
93
-
94
-
95
-
96
-
97
-
98
-
99
-
100
-
101
-
102
-
103
-
104
-
105
-
106
-
107
-
108
-
109
-
110
-
111
-
112
-
113
-
114
-
115
-
116
-
117
-
118
-
119
-
120
-
121
-
122
-
123
-
124
-
125
-
126
-
127
-
128
-
129
-
130
-
131
-
132
-
133
-
134
-
135
-
136
-
137
-
138
-
139
-
140
-
141
-
142
-
143
-
144
-
145
-
146
-
147
-
148
-
149
-
150
-
151
-
152
-
153
-
154
-
155
-
156
-
157
-
158
-
159
-
160
-
161
-
162
-
163
-
164
-
165
-
166
-
167
-
168
-
169
-
170
-
171
-
172
-
173
-
174
-
175
-
176
-
177
-
178
-
179
-
180
-
181
-
182
-
183
-
184
-
185
-
186
-
187
-
188
-
189
-
190
-
191
-
192
-
193
-
194
-
195
-
196
-
197
-
198
-
199
-
200
-
201
-
202
-
203
-
204
-
205
-
206
-
207
-
208
-
209
-
210
-
211
-
212
-
213
-
214
-
215
-
216
-
217
-
218
-
219
-
220
-
221
-
222
-
223
-
224
-
225
-
226
-
227
-
228
-
229
-
230
-
231
-
232
-
233
-
234
-
235
-
236
-
237
-
238
-
239
-
240
-
241
-
242
-
243
-
244
-
245
-
246
-
247
-
248
-
249
-
250
-
251
-
252
-
253
-
254
-
255
-
256
-
257
-
258
-
259
-
260
-
261
-
262
-
263
-
264
-
265
-
266
-
267
-
268
-
269
-
270
-
271
-
272
-
273
-
274
-
275
-
276
-
277
-
278
-
279
-
280
-
281
-
282
-
283
-
284
-
285
-
286
-
287
-
288
-
289
-
290
-
291
-
292
-
293
-
294
-
295
-
296
-
297
-
298
-
299
-
300
-
301
-
302
-
303
-
304
-
305
-
306
-
307
-
308
-
309
-
310
-
311
-
312
-
313
-
314
-
315
-
316
-
317
-
318
-
319
-
320
-
321
-
322
-
323
-
324
-
325
-
326
-
327
-
328
-
329
-
330
-
331
-
332
-
333
-
334
-
335
-
336
-
337
-
338
-
339
-
340
-
341
-
342
-
343
-
344
-
345
-
346
-
347
-
348
-
349
-
350
-
351
-
352
-
353
-
354
-
355
-
356
-
357
-
358
-
359
-
360
-
361
-
362
-
363
-
364
-
365
-
366
-
367
-
368
-
369
-
370
-
371
-
372
-
373
-
374
-
375
-
376
-
377
-
378
-
379
-
380
-
381
-
382
-
383
-
384
-
385
-
386
-
387
-
388
-
389
-
390
-
391
-
392
-
393
-
394
-
395
-
396
-
397
-
398
-
399
-
400
-
401
-
402
-
403
-
404
-
405
-
406
-
407
-
408
-
409
-
410
-
411
-
412
-
413
-
414
-
415
-
416
-
417
-
418
-
419
-
420
-
421
-
422
-
423
-
424
-
425
-
426
-
427
-
428
-
429
-
430
-
431
-
432
-
433
-
434
-
435
-
436
-
437
-
438
-
439
-
440
-
441
-
442
-
443
-
444
-
445
-
446
-
447
-
448
-
449
-
450
-
451
-
452
-
453
-
454
-
455
-
456
-
457
-
458
-
459
-
460
-
461
 |
 |
Table of Contents
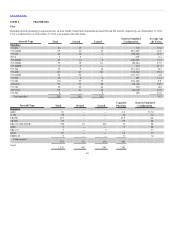
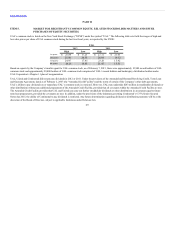
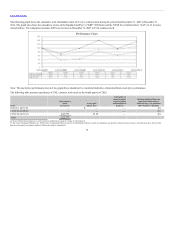
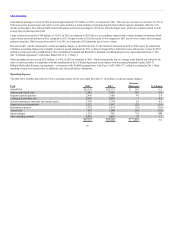
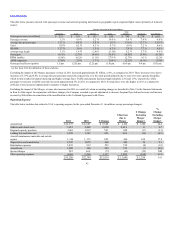
Presented below is the Company’s operating data for the years ended December 31. The 2012, 2011 and 2010 operating data includes results of Continental
Successor.
Passengers (thousands) (a) 93,595 96,360 65,365 56,082 63,149
Revenue passenger miles (“RPMs”) (millions) (b) 179,416 181,763 122,182 100,475 110,061
Available seat miles (“ASMs”) (millions) (c) 216,330 219,437 145,738 122,737 135,861
Cargo ton miles (millions) 2,460 2,646 2,176 1,603 1,921
Passenger load factor (d)
Mainline 82.9% 82.8% 83.8% 81.9% 81.0%
Domestic 84.9% 85.1% 84.8% 83.7% 82.6%
International 80.9% 80.5% 82.7% 79.4% 79.0%
Passenger revenue per available seat mile (“PRASM”) (cents) 11.93 11.84 10.99 9.22 10.91
Total revenue per available seat mile (cents) 13.92 13.77 12.91 10.81 12.58
Average yield per revenue passenger mile (“Yield”) (cents) (e) 14.38 14.29 13.11 11.26 13.47
Average fare per revenue passenger (f) $275.70 $269.56 $245.06 $201.72 $234.71
Cost per available seat mile (“CASM”) (cents) 14.12 13.15 12.51 11.05 15.74
Average price per gallon of fuel, including fuel taxes $3.27 $3.01 $2.27 $1.75 $3.54
Fuel gallons consumed (millions) 3,275 3,303 2,280 1,942 2,182
Aircraft in fleet at end of period (g) 702 701 710 360 409
Average stage length (miles) (h) 1,895 1,844 1,789 1,701 1,677
Average daily utilization of each aircraft (hours) (i) 10:38 10:42 10:47 10:47 10:42
Passengers (thousands) (a) 46,846 45,439 32,764 25,344 23,278
RPMs (millions) (b) 26,069 25,768 18,675 13,770 12,155
ASMs (millions) (c) 32,530 33,091 23,827 17,979 16,164
Passenger load factor (d) 80.1% 77.9% 78.4% 76.6% 75.2%
PRASM (cents) 20.84 19.75 17.70 16.04 18.44
Yield (cents) (e) 26.00 25.36 22.58 20.95 24.52
Aircraft in fleet at end of period (g) 551 555 552 292 280
Passengers (thousands) (a) 140,441 141,799 98,129 81,426 86,427
RPMs (millions) (b) 205,485 207,531 140,857 114,245 122,216
ASMs (millions) (c) 248,860 252,528 169,565 140,716 152,025
Passenger load factor (d) 82.6% 82.2% 83.1% 81.2% 80.4%
PRASM (cents) 13.09 12.87 11.93 10.09 11.71
Yield (cents) (e) 15.86 15.67 14.37 12.43 14.57
CASM (cents) 14.91 13.97 13.18 11.72 16.20
Average price per gallon of fuel, including fuel taxes $3.27 $3.06 $2.39 $1.80 $3.52
Fuel gallons consumed (millions) 4,016 4,038 2,798 2,338 2,553
(a) The number of revenue passengers measured by each flight segment flown.
(b) The number of scheduled miles flown by revenue passengers.
32