US Cellular 2013 Annual Report Download - page 39
Download and view the complete annual report
Please find page 39 of the 2013 US Cellular annual report below. You can navigate through the pages in the report by either clicking on the pages listed below, or by using the keyword search tool below to find specific information within the annual report.-
 1
1 -
2
-
3
-
4
-
5
-
6
-
7
-
8
-
9
-
10
-
11
-
12
-
13
-
14
-
15
-
16
-
17
-
18
-
19
-
20
-
21
-
22
-
23
-
24
-
25
-
26
-
27
-
28
-
 29
29 -
 30
30 -
 31
31 -
 32
32 -
 33
33 -
 34
34 -
 35
35 -
 36
36 -
 37
37 -
 38
38 -
 39
39 -
 40
40 -
 41
41 -
 42
42 -
 43
43 -
 44
44 -
 45
45 -
 46
46 -
 47
47 -
 48
48 -
 49
49 -
50
-
51
-
52
-
53
-
54
-
55
-
56
-
57
-
58
-
59
-
60
-
61
-
62
-
63
-
64
-
65
-
66
-
67
-
68
-
69
-
70
-
71
-
72
-
73
-
74
-
75
-
76
-
77
-
78
-
79
-
80
-
81
-
82
-
83
-
84
-
85
-
86
-
87
-
88
 |
 |

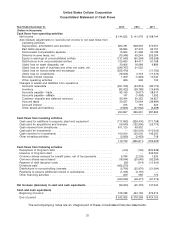
United States Cellular Corporation
Consolidated Statement of Cash Flows
Year Ended December 31, 2013 2012 2011
(Dollars in thousands)
Cash flows from operating activities
Net income ............................................. $144,522 $ 141,076 $ 198,744
Add (deduct) adjustments to reconcile net income to net cash flows from
operating activities
Depreciation, amortization and accretion ....................... 803,781 608,633 573,557
Bad debts expense ...................................... 98,864 67,372 62,157
Stock-based compensation expense .......................... 15,844 21,466 20,183
Deferred income taxes, net ................................. (75,348) 49,244 203,264
Equity in earnings of unconsolidated entities ..................... (131,949) (90,364) (83,566)
Distributions from unconsolidated entities ....................... 125,660 84,417 91,768
(Gain) loss on asset disposals, net ........................... 30,606 18,088 9,889
(Gain) loss on sale of business and other exit costs, net ............. (246,767) 21,022 —
(Gain) loss on license sales and exchanges ..................... (255,479) — (11,762)
(Gain) loss on investments ................................. (18,556) 3,718 (11,373)
Noncash interest expense ................................. 1,059 (1,822) 10,040
Other operating activities .................................. 646 546 102
Changes in assets and liabilities from operations
Accounts receivable ..................................... (291,759) (64,816) (82,175)
Inventory ............................................. (82,422) (28,786) (14,640)
Accounts payable—trade .................................. 85,199 (4,977) 28,410
Accounts payable—affiliate ................................. 147 (1,458) 1,392
Customer deposits and deferred revenues ...................... 66,344 30,353 34,927
Accrued taxes ......................................... 30,037 73,064 (39,984)
Accrued interest ........................................ 273 167 225
Other assets and liabilities ................................. (9,805) (27,652) (3,296)
290,897 899,291 987,862
Cash flows from investing activities
Cash used for additions to property, plant and equipment ............. (717,862) (826,400) (771,798)
Cash paid for acquisitions and licenses .......................... (16,540) (122,690) (23,773)
Cash received from divestitures ............................... 811,120 49,932 —
Cash paid for investments ................................... — (120,000) (110,000)
Cash received for investments ................................ 100,000 125,000 145,250
Other investing activities .................................... (3,969) (2,453) 718
172,749 (896,611) (759,603)
Cash flows from financing activities
Repayment of long-term debt ................................ (414) (145) (330,338)
Issuance of long-term debt .................................. — — 342,000
Common shares reissued for benefit plans, net of tax payments ......... 5,784 (2,205) 1,935
Common shares repurchased ................................ (18,544) (20,045) (62,294)
Payment of debt issuance costs ............................... (23) (514) (11,400)
Dividends paid .......................................... (482,270) — —
Distributions to noncontrolling interests .......................... (3,766) (22,970) (21,094)
Payments to acquire additional interest in subsidiaries ................ (1,005) (3,167) —
Other financing activities .................................... 299 569 172
(499,939) (48,477) (81,019)
Net increase (decrease) in cash and cash equivalents ............... (36,293) (45,797) 147,240
Cash and cash equivalents
Beginning of period ....................................... 378,358 424,155 276,915
End of period ........................................... $342,065 $ 378,358 $ 424,155
The accompanying notes are an integral part of these consolidated financial statements.
31