US Cellular 2013 Annual Report Download - page 22
Download and view the complete annual report
Please find page 22 of the 2013 US Cellular annual report below. You can navigate through the pages in the report by either clicking on the pages listed below, or by using the keyword search tool below to find specific information within the annual report.-
 1
1 -
2
-
3
-
4
-
5
-
6
-
7
-
8
-
9
-
10
-
11
-
 12
12 -
 13
13 -
 14
14 -
 15
15 -
 16
16 -
 17
17 -
 18
18 -
 19
19 -
 20
20 -
 21
21 -
 22
22 -
 23
23 -
 24
24 -
 25
25 -
 26
26 -
 27
27 -
 28
28 -
 29
29 -
 30
30 -
 31
31 -
 32
32 -
33
-
34
-
35
-
36
-
37
-
38
-
39
-
40
-
41
-
42
-
43
-
44
-
45
-
46
-
47
-
48
-
49
-
50
-
51
-
52
-
53
-
54
-
55
-
56
-
57
-
58
-
59
-
60
-
61
-
62
-
63
-
64
-
65
-
66
-
67
-
68
-
69
-
70
-
71
-
72
-
73
-
74
-
75
-
76
-
77
-
78
-
79
-
80
-
81
-
82
-
83
-
84
-
85
-
86
-
87
-
88
 |
 |

United States Cellular Corporation
Management’s Discussion and Analysis of Financial Condition and Results of Operations
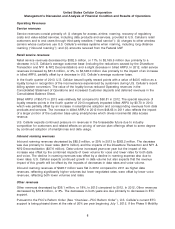
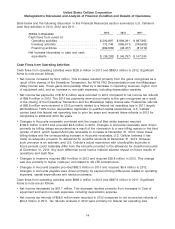
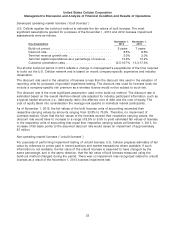
table below and the following discussion in this Financial Resources section summarize U.S. Cellular’s
cash flow activities in 2013, 2012 and 2011.
2013 2012 2011
(Dollars in thousands)
Cash flows from (used in)
Operating activities ..................... $290,897 $ 899,291 $ 987,862
Investing activities ...................... 172,749 (896,611) (759,603)
Financing activities ..................... (499,939) (48,477) (81,019)
Net increase (decrease) in cash and cash
equivalents ........................... $ (36,293) $ (45,797) $ 147,240
Cash Flows from Operating Activities
Cash flows from operating activities were $290.9 million in 2013 and $899.3 million in 2012. Significant
items to note are as follows:
• Net income increased by $3.4 million. This increase resulted primarily from the gains recognized as a
result of the closing of the Divestiture Transaction, the NY1& NY2 Deconsolidation and the Mississippi
Valley license sale. These gains were partially offset by a decrease in Operating revenues, higher cost
of equipment sold, and an increase in non-cash expenses, including depreciation expense.
• Net income tax payments of $157.8 million were recorded in 2013 compared to net income tax refunds
of $58.6 million in 2012. The 2013 tax payments were due primarily to the gain recognized as a result
of the closing of the Divestiture Transaction and the Mississippi Valley license sale. Federal tax refunds
of $66.8 million were received in 2012 primarily related to a federal net operating loss in 2011 largely
attributable to 100% bonus depreciation applicable to qualified capital expenditures. U.S. Cellular
carried back this federal net operating loss to prior tax years and received these refunds in 2012 for
carrybacks to 2009 and 2010 tax years.
• Changes in Accounts receivable combined with the impact of Bad debts expense required
$192.9 million in 2013 and provided $2.6 million in 2012. Changes in Accounts receivable were driven
primarily by billing delays encountered as a result of the conversion to a new billing system in the third
quarter of 2013, which caused Accounts receivable to increase at December 31, 2013. Given these
billing delays and the corresponding increase in Accounts receivable, U.S. Cellular believes it has
made an adequate provision for allowance for doubtful accounts at December 31, 2013. However,
such provision is an estimate, and U.S. Cellular’s actual experience with uncollectible accounts in
future periods could materially differ from the amounts provided in the allowance for doubtful accounts
at December 31, 2013. Any such difference could have a material adverse impact on future results of
operations and cash flow.
• Changes in Inventory required $82.4 million in 2013 and required $28.8 million in 2012. This change
was due primarily to higher costs per unit related to 4G LTE smartphones.
• Changes in Accounts payable provided $85.3 million in 2013 and required $6.4 million in 2012.
Changes in Accounts payable were driven primarily by payment timing differences related to operating
expenses, capital expenditures and device purchases.
Cash flows from operating activities were $899.3 million in 2012 and $987.9 million in 2011. Significant
items to note are as follows:
• Net income decreased by $57.7 million. This decrease resulted primarily from increases in Cost of
equipment sold and non-cash expenses, including depreciation expense.
• Net income tax refunds of $58.6 million were recorded in 2012 compared to net income tax refunds of
$54.4 million in 2011. Tax refunds received in 2012 were primarily for federal net operating loss
14