US Cellular 2013 Annual Report Download - page 19
Download and view the complete annual report
Please find page 19 of the 2013 US Cellular annual report below. You can navigate through the pages in the report by either clicking on the pages listed below, or by using the keyword search tool below to find specific information within the annual report.-
 1
1 -
2
-
3
-
4
-
5
-
6
-
7
-
8
-
 9
9 -
 10
10 -
 11
11 -
 12
12 -
 13
13 -
 14
14 -
 15
15 -
 16
16 -
 17
17 -
 18
18 -
 19
19 -
 20
20 -
 21
21 -
 22
22 -
 23
23 -
 24
24 -
 25
25 -
 26
26 -
 27
27 -
 28
28 -
 29
29 -
30
-
31
-
32
-
33
-
34
-
35
-
36
-
37
-
38
-
39
-
40
-
41
-
42
-
43
-
44
-
45
-
46
-
47
-
48
-
49
-
50
-
51
-
52
-
53
-
54
-
55
-
56
-
57
-
58
-
59
-
60
-
61
-
62
-
63
-
64
-
65
-
66
-
67
-
68
-
69
-
70
-
71
-
72
-
73
-
74
-
75
-
76
-
77
-
78
-
79
-
80
-
81
-
82
-
83
-
84
-
85
-
86
-
87
-
88
 |
 |
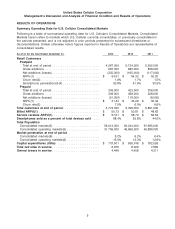
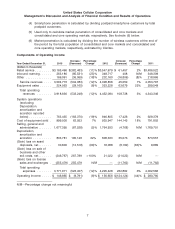
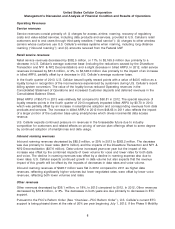
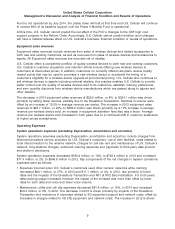
United States Cellular Corporation
Management’s Discussion and Analysis of Financial Condition and Results of Operations
2012—
• Selling and marketing expenses decreased by $24.8 million, or 3%, primarily from more cost-effective
advertising spending.
• General and administrative expenses increased by $20.1 million, or 2%, driven by increases in bad
debts expense, Federal Universal Service Charge (‘‘FUSC’’) expense and non-income tax expense.
FUSC charges are assessed to customers and also included in Service revenues.
Depreciation, amortization and accretion
Depreciation, amortization and accretion expense increased $195.1 million, or 32%, in 2013, and
$35.1 million, or 6%, in 2012 due primarily to the acceleration of depreciation, amortization and accretion
in the Divestiture Markets. The impact of the acceleration year over year was $158.5 million in 2013. The
accelerated depreciation, amortization and accretion in the Divestiture Markets is expected to conclude in
the first quarter of 2014.
(Gain) loss on asset disposals, net
(Gain) loss on asset disposals, net was a loss of $30.6 million in 2013 and $18.1 million in 2012 due
primarily to losses resulting from the write-off and disposals of certain network assets.
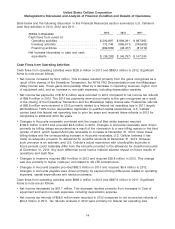
(Gain) loss on sale of business and other exit costs, net
(Gain) loss on sale of business and other exit costs, net was a gain of $246.8 million in 2013, primarily
related to the closing of the Divestiture Transaction. The loss of $21.0 million in 2012 was due primarily
to employee severance costs and asset write-offs in the Divestiture Markets, partially offset by a
$4.2 million gain resulting from the sale of a wireless market in March 2012.
(Gain) loss on license sales and exchanges
(Gain) loss on license sales and exchanges resulted from the sale of the Mississippi Valley non-operating
market license for $308.0 million, which resulted in a pre-tax gain of $250.6 million.
11