US Cellular 2013 Annual Report Download - page 23
Download and view the complete annual report
Please find page 23 of the 2013 US Cellular annual report below. You can navigate through the pages in the report by either clicking on the pages listed below, or by using the keyword search tool below to find specific information within the annual report.
United States Cellular Corporation
Management’s Discussion and Analysis of Financial Condition and Results of Operations
carrybacks from the 2011 tax year to the 2009 and 2010 tax years. Tax refunds received in 2011
primarily represented federal refunds related to overpayment of 2010 taxes.
• Changes in Accounts receivable combined with the impact of Bad debts expense provided $2.6 million
in 2012 and required $20.0 million in 2011. Accounts receivable balances fluctuate based on the timing
of customer payments, promotions and other factors.
• Changes in Inventory required $28.8 million in 2012 and $14.6 million in 2011. This change was due
primarily to higher inventory levels and a change in inventory mix resulting in a higher cost per unit.
• Changes in Accounts payable required $6.4 million in 2012 and provided $29.8 million in 2011.
Changes in Accounts payable were primarily driven by payment timing differences related to network
equipment and device purchases.
• Changes in Other assets and liabilities required $27.7 million and $3.3 million in 2012 and 2011,
respectively. This change was due primarily to an increase in LTE-related deferred charges.
Cash Flows from Investing Activities
U.S. Cellular makes substantial investments to acquire wireless licenses and properties and to construct
and upgrade wireless telecommunications networks and facilities as a basis for creating long-term value
for shareholders. In recent years, rapid changes in technology and new opportunities have required
substantial investments in potentially revenue-enhancing and cost-reducing upgrades of U.S. Cellular’s
networks.
The primary purpose of U.S. Cellular’s construction and expansion expenditures is to provide for
customer and usage growth, to upgrade service and to take advantage of service-enhancing and
cost-reducing technological developments.
Capital expenditures (i.e., additions to property, plant and equipment and system development
expenditures) totaled $737.5 million in 2013, $836.7 million in 2012 and $782.5 million in 2011. Cash
used for additions to property, plant and equipment is reported in the Consolidated Statement of Cash
Flows, and excludes amounts accrued in Accounts payable for capital expenditures at December 31 of
the current year and includes amounts paid in the current period that were accrued at December 31 of
the prior year. Cash used for additions to property, plant and equipment totaled $717.9 million,
$826.4 million and $771.8 million in 2013, 2012 and 2011, respectively. These expenditures were made
to construct new cell sites, build out 4G LTE networks in certain markets, increase capacity in existing
cell sites and switches, develop new and enhance existing office systems such as the new Billing and
Operational Support System (‘‘B/OSS’’) and customer relationship management platforms, and construct
new and remodel existing retail stores. The decrease in capital expenditures on a year-over-year basis is
due primarily to the timing of spending for network operations equipment.
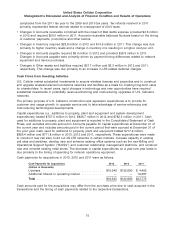
Cash payments for acquisitions in 2013, 2012 and 2011 were as follows:
Cash Payments for Acquisitions 2013 2012 2011
(Dollars in thousands)
Licenses .................................. $16,540 $122,690 $ 4,406
Additional interest in operating market ............ — — 19,367
Total ..................................... $16,540 $122,690 $23,773
Cash amounts paid for the acquisitions may differ from the purchase price due to cash acquired in the
transactions and the timing of cash payments related to the respective transactions.
15


