US Cellular 2013 Annual Report Download - page 18
Download and view the complete annual report
Please find page 18 of the 2013 US Cellular annual report below. You can navigate through the pages in the report by either clicking on the pages listed below, or by using the keyword search tool below to find specific information within the annual report.-
 1
1 -
2
-
3
-
4
-
5
-
6
-
7
-
 8
8 -
 9
9 -
 10
10 -
 11
11 -
 12
12 -
 13
13 -
 14
14 -
 15
15 -
 16
16 -
 17
17 -
 18
18 -
 19
19 -
 20
20 -
 21
21 -
 22
22 -
 23
23 -
 24
24 -
 25
25 -
 26
26 -
 27
27 -
 28
28 -
29
-
30
-
31
-
32
-
33
-
34
-
35
-
36
-
37
-
38
-
39
-
40
-
41
-
42
-
43
-
44
-
45
-
46
-
47
-
48
-
49
-
50
-
51
-
52
-
53
-
54
-
55
-
56
-
57
-
58
-
59
-
60
-
61
-
62
-
63
-
64
-
65
-
66
-
67
-
68
-
69
-
70
-
71
-
72
-
73
-
74
-
75
-
76
-
77
-
78
-
79
-
80
-
81
-
82
-
83
-
84
-
85
-
86
-
87
-
88
 |
 |
United States Cellular Corporation
Management’s Discussion and Analysis of Financial Condition and Results of Operations
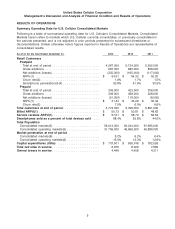
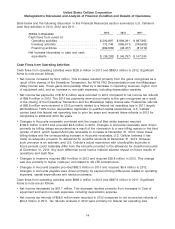
primarily by an increase in the number of cell sites within U.S. Cellular’s network and costs related to
the deployment and operation of LTE networks.
• Customer usage expenses decreased by $57.7 million, or 19%, in 2013, and increased by $4.1 million,
or 1%, in 2012. The decrease in 2013 is driven by impacts of the Divestiture Transaction and
decreases in intercarrier charges as a result of the FCC’s Reform Order and certain data costs,
partially offset by increases due to network costs for 4G LTE. The increase in 2012 is due primarily to
an increase in data capacity and usage, offset by a decline in voice usage as well as reduced
intercarrier compensation expenses as a result of the FCC’s Reform Order.
U.S. Cellular expects system operations expenses to increase in the future to support the continued
growth in cell sites and other network facilities as it continues to add capacity, enhance quality and
deploy new technologies as well as to support increases in total customer usage, particularly data
usage. However, these increases are expected to be offset to some extent by cost savings generated by
shifting data traffic to the 4G LTE network from the 3G network.
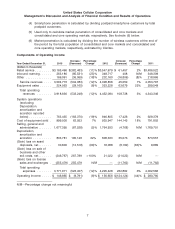
Cost of equipment sold
Cost of equipment sold increased $63.1 million, or 7%, in 2013 and $144.1 million, or 18% in 2012. In
both years, the increase was driven primarily by an increase in the average cost per wireless device sold
(33% in 2013 and 18% in 2012). Average cost per device sold increased due to general customer
preference for higher priced 4G LTE smartphones, including the introduction of Apple products in the
fourth quarter of 2013. In 2013, total devices sold decreased by 18% partially due to the Divestiture
Transaction; in 2012, total devices sold increased by 1%.
U.S. Cellular’s loss on equipment, defined as equipment sales revenues less cost of equipment sold,
was $674.9 million, $582.7 million and $502.3 million for 2013, 2012 and 2011, respectively. U.S. Cellular
expects loss on equipment to continue to be a significant cost in the foreseeable future as wireless
carriers continue to use device pricing as a means of competitive differentiation. In addition, U.S. Cellular
expects increasing sales of data centric wireless devices to result in higher equipment subsidies over
time; these devices generally have higher purchase costs which cannot be recovered through
proportionately higher selling prices to customers under the standard contract/subsidy model the
industry has operated with for many years. However, U.S. Cellular is beginning to offer new equipment
pricing constructs such as device financing to offset a higher proportion of increasing equipment costs.
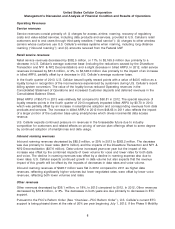
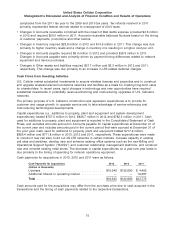
Selling, general and administrative expenses
Selling, general and administrative expenses include salaries, commissions and expenses of field sales
and retail personnel and facilities; telesales department salaries and expenses; agent commissions and
related expenses; corporate marketing and merchandise management; and advertising expenses.
Selling, general and administrative expenses also include bad debts expense, costs of operating
customer care centers and corporate expenses.
Selling, general and administrative expenses decreased by $87.5 million to $1,677.4 million in 2013 and
by $4.8 million to $1,764.9 in 2012. Key components of the net changes in Selling, general and
administrative expenses were as follows:
2013—
• Selling and marketing expenses decreased by $75.7 million, or 9%, primarily from lower commission
expenses, more cost-effective advertising spending and reduced employee and facilities costs as a
result of the Divestiture Transaction.
• General and administrative expenses decreased by $11.8 million, or 1%, driven by corporate cost
containment and reduction initiatives and reduced spending as a result of the Divestiture Transaction,
offset by costs associated with launching the new billing system of $55.8 million and higher bad debts
expense of $31.5 million due to higher customer accounts receivable balances resulting from billing
issues experienced after the system conversion.
10