US Cellular 2013 Annual Report Download - page 30
Download and view the complete annual report
Please find page 30 of the 2013 US Cellular annual report below. You can navigate through the pages in the report by either clicking on the pages listed below, or by using the keyword search tool below to find specific information within the annual report.-
 1
1 -
2
-
3
-
4
-
5
-
6
-
7
-
8
-
9
-
10
-
11
-
12
-
13
-
14
-
15
-
16
-
17
-
18
-
19
-
 20
20 -
 21
21 -
 22
22 -
 23
23 -
 24
24 -
 25
25 -
 26
26 -
 27
27 -
 28
28 -
 29
29 -
 30
30 -
 31
31 -
 32
32 -
 33
33 -
 34
34 -
 35
35 -
 36
36 -
 37
37 -
 38
38 -
 39
39 -
 40
40 -
41
-
42
-
43
-
44
-
45
-
46
-
47
-
48
-
49
-
50
-
51
-
52
-
53
-
54
-
55
-
56
-
57
-
58
-
59
-
60
-
61
-
62
-
63
-
64
-
65
-
66
-
67
-
68
-
69
-
70
-
71
-
72
-
73
-
74
-
75
-
76
-
77
-
78
-
79
-
80
-
81
-
82
-
83
-
84
-
85
-
86
-
87
-
88
 |
 |

United States Cellular Corporation
Management’s Discussion and Analysis of Financial Condition and Results of Operations
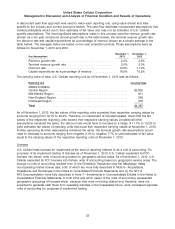
A discounted cash flow approach was used to value each reporting unit, using value drivers and risks
specific to the industry and current economic factors. The cash flow estimates incorporated assumptions that
market participants would use in their estimates of fair value and may not be indicative of U.S. Cellular
specific assumptions. The most significant assumptions made in this process were the revenue growth rate
(shown as a ten year compound annual growth rate in the table below), the terminal revenue growth rate,
the discount rate and capital expenditures as a percentage of revenue (shown as a simple average in the
table below). The averages below are based on ten year projection periods. These assumptions were as
follows for November 1, 2013 and 2012:
November 1, November 1,
Key Assumptions 2013 2012
Revenue growth rate .............................. 2.2% 2.2%
Terminal revenue growth rate ......................... 2.0% 2.0%
Discount rate .................................... 10.0% 11.0%
Capital expenditures as a percentage of revenue ........... 16.0% 15.2%
The carrying value of each U.S. Cellular reporting unit as of November 1, 2013 was as follows:
Reporting Unit Carrying Value
(Dollars in millions)
Central Region ........................................... $2,902
Mid-Atlantic Region ........................................ 811
New England Region ...................................... 256
Northwest Region ......................................... 318
Total .................................................. $4,287
As of November 1, 2013, the fair values of the reporting units exceeded their respective carrying values by
amounts ranging from 19.1% to 40.2%. Therefore, no impairment of Goodwill existed. Given that the fair
values of the respective reporting units exceed their respective carrying values, provided all other
assumptions remained the same, the discount rate would have to increase to a range of 11.7% to 13.2% to
yield estimated fair values of reporting units that equal their respective carrying values at November 1, 2013.
Further, assuming all other assumptions remained the same, the terminal growth rate assumptions would
need to decrease to amounts ranging from negative 2.1% to negative 7.7% to yield estimates of fair value
equal to the carrying values of the respective reporting units at November 1, 2013.
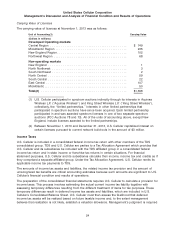
Licenses
U.S. Cellular tests licenses for impairment at the level of reporting referred to as a unit of accounting. For
purposes of its impairment testing of licenses as of November 1, 2013, U.S. Cellular separated its FCC
licenses into eleven units of accounting based on geographic service areas. As of November 1, 2012, U.S.
Cellular separated its FCC licenses into thirteen units of accounting based on geographic service areas. The
change in units of accounting resulted from (i) the Divestiture Transaction and the Mississippi Valley
non-operating market license sale, both of which are more fully described in Note 5—Acquisitions,
Divestitures and Exchanges in the Notes to Consolidated Financial Statements and (ii) the NY1 &
NY2 Deconsolidation more fully described in Note 7—Investments in Unconsolidated Entities in the Notes to
Consolidated Financial Statements. In both 2013 and 2012, seven of the units of accounting represented
geographic groupings of licenses which, because they were not being utilized and, therefore, were not
expected to generate cash flows from operating activities in the foreseeable future, were considered separate
units of accounting for purposes of impairment testing.
22