US Cellular 2013 Annual Report Download - page 13
Download and view the complete annual report
Please find page 13 of the 2013 US Cellular annual report below. You can navigate through the pages in the report by either clicking on the pages listed below, or by using the keyword search tool below to find specific information within the annual report.-
 1
1 -
2
-
 3
3 -
 4
4 -
 5
5 -
 6
6 -
 7
7 -
 8
8 -
 9
9 -
 10
10 -
 11
11 -
 12
12 -
 13
13 -
 14
14 -
 15
15 -
 16
16 -
 17
17 -
 18
18 -
 19
19 -
 20
20 -
 21
21 -
 22
22 -
 23
23 -
24
-
25
-
26
-
27
-
28
-
29
-
30
-
31
-
32
-
33
-
34
-
35
-
36
-
37
-
38
-
39
-
40
-
41
-
42
-
43
-
44
-
45
-
46
-
47
-
48
-
49
-
50
-
51
-
52
-
53
-
54
-
55
-
56
-
57
-
58
-
59
-
60
-
61
-
62
-
63
-
64
-
65
-
66
-
67
-
68
-
69
-
70
-
71
-
72
-
73
-
74
-
75
-
76
-
77
-
78
-
79
-
80
-
81
-
82
-
83
-
84
-
85
-
86
-
87
-
88
 |
 |

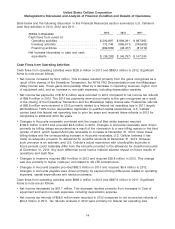
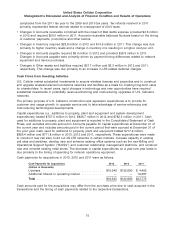
United States Cellular Corporation
Management’s Discussion and Analysis of Financial Condition and Results of Operations
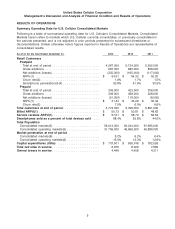
RESULTS OF OPERATIONS
Summary Operating Data for U.S. Cellular Consolidated Markets
Following is a table of summarized operating data for U.S. Cellular’s Consolidated Markets. Consolidated
Markets herein refers to markets which U.S. Cellular currently consolidates, or previously consolidated in
the periods presented, and is not adjusted in prior periods presented for subsequent divestitures or
deconsolidations. Unless otherwise noted, figures reported in Results of Operations are representative of
consolidated results.
As of or for the Year Ended December 31, 2013 2012 2011
Retail Customers
Postpaid
Total at end of period .......................... 4,267,000 5,134,000 5,302,000
Gross additions .............................. 697,000 880,000 836,000
Net additions (losses) .......................... (325,000) (165,000) (117,000)
ARPU(1) ................................... $ 54.31 $ 54.32 $ 52.20
Churn rate(2) ................................ 1.8% 1.7% 1.5%
Smartphone penetration(3)(4) .................... 50.8% 41.8% 30.5%
Prepaid
Total at end of period .......................... 343,000 423,000 306,000
Gross additions .............................. 309,000 368,000 228,000
Net additions (losses) .......................... (21,000) 118,000 (8,000)
ARPU(1) ................................... $ 31.44 $ 33.26 $ 33.42
Churn rate(2) ................................ 7.0% 6.0% 6.6%
Total customers at end of period .................... 4,774,000 5,798,000 5,891,000
Billed ARPU(1) ................................. $ 50.73 $ 50.81 $ 48.63
Service revenue ARPU(1) ......................... $ 57.61 $ 58.70 $ 56.54
Smartphones sold as a percent of total devices sold .... 68.4% 55.8% 44.0%
Total Population
Consolidated markets(5) ......................... 58,013,000 93,244,000 91,965,000
Consolidated operating markets(5) .................. 31,759,000 46,966,000 46,888,000
Market penetration at end of period
Consolidated markets(6) ......................... 8.2% 6.2% 6.4%
Consolidated operating markets(6) .................. 15.0% 12.3% 12.6%
Capital expenditures (000s) ....................... $ 737,501 $ 836,748 $ 782,526
Total cell sites in service .......................... 6,975 8,028 7,882
Owned towers in service .......................... 4,448 4,408 4,311
5