US Cellular 2013 Annual Report Download - page 10
Download and view the complete annual report
Please find page 10 of the 2013 US Cellular annual report below. You can navigate through the pages in the report by either clicking on the pages listed below, or by using the keyword search tool below to find specific information within the annual report.-
 1
1 -
 2
2 -
 3
3 -
 4
4 -
 5
5 -
 6
6 -
 7
7 -
 8
8 -
 9
9 -
 10
10 -
 11
11 -
 12
12 -
 13
13 -
 14
14 -
 15
15 -
 16
16 -
 17
17 -
 18
18 -
 19
19 -
 20
20 -
 21
21 -
22
-
23
-
24
-
25
-
26
-
27
-
28
-
29
-
30
-
31
-
32
-
33
-
34
-
35
-
36
-
37
-
38
-
39
-
40
-
41
-
42
-
43
-
44
-
45
-
46
-
47
-
48
-
49
-
50
-
51
-
52
-
53
-
54
-
55
-
56
-
57
-
58
-
59
-
60
-
61
-
62
-
63
-
64
-
65
-
66
-
67
-
68
-
69
-
70
-
71
-
72
-
73
-
74
-
75
-
76
-
77
-
78
-
79
-
80
-
81
-
82
-
83
-
84
-
85
-
86
-
87
-
88
 |
 |
United States Cellular Corporation
Management’s Discussion and Analysis of Financial Condition and Results of Operations
• In the fourth quarter of 2013, U.S. Cellular issued loyalty reward points with a value of $43.5 million as
a loyalty bonus in recognition of the inconvenience experienced by customers during U.S. Cellular’s
recent billing system conversion. The loyalty bonus reduced Operating revenues in the Consolidated
Statement of Operations and increased Customer deposits and deferred revenues in the Consolidated
Balance Sheet.
• Total consolidated customers were 4,774,000 at December 31, 2013, including 4,610,000 retail
customers (97% of total).
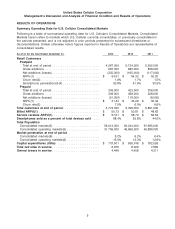
The following operating information is presented for Core Markets. As used here, Core Markets is defined
as all consolidated markets in which U.S. Cellular currently conducts business and, therefore, excludes
the Divestiture Markets and the NY1 & NY2 Deconsolidated Markets. Core Markets as defined also
includes any other income or expenses due to U.S. Cellular’s direct or indirect ownership interests in
other spectrum in the Divestiture Markets which was not included in the Divestiture Transaction and other
retained assets from the Divestiture Markets.
• Retail customer net losses were 215,000 in 2013 compared to net additions of 32,000 in 2012. In the
postpaid category, there were net losses of 217,000 in 2013, compared to net losses of 92,000 in
2012. Prepaid net additions were 2,000 in 2013 compared to net additions of 124,000 in 2012.
• Postpaid customers comprised approximately 93% of U.S. Cellular’s retail customers as of
December 31, 2013 and December 31, 2012. The postpaid churn rate was 1.7% in 2013 and 1.5% in
2012. The prepaid churn rate was 6.7% in 2013 and 5.2% in 2012.
• Billed average revenue per user (‘‘ARPU’’) increased to $50.82 in 2013 from $50.54 in 2012 reflecting
an increase in postpaid ARPU due to increases in smartphone adoption and corresponding revenues
from data products and services, offset by a decrease in prepaid ARPU. Service revenue ARPU
decreased to $57.66 in 2013 from $58.49 in 2012 due primarily to decreases in inbound roaming and
eligible telecommunications carriers (‘‘ETC’’) revenues. The special issuance of loyalty rewards points
in the fourth quarter of 2013 negatively impacted both billed ARPU and service revenue ARPU by
$0.73 in 2013.
• Postpaid customers on smartphone service plans increased to 51% as of December 31, 2013
compared to 41% as of December 31, 2012. In addition, smartphones represented 69% of all devices
sold in 2013 compared to 56% in 2012.
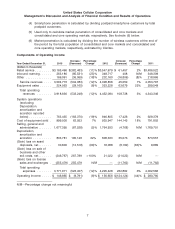
The following financial information is presented for U.S. Cellular consolidated results:
• Retail service revenues of $3,165.5 million decreased $382.5 million year-over-year, due to a decrease
of 619,000 in the average number of customers (including approximately 550,000 due to the
reductions caused by the Divestiture Transaction and NY1 & NY2 Deconsolidation).
• Cash flows from operating activities were $290.9 million in 2013 compared to $899.3 million in 2012. At
December 31, 2013, Cash and cash equivalents and Short-term investments totaled $392.2 million and
there were no outstanding borrowings under the revolving credit facility.
• Total additions to Property, plant and equipment were $737.5 million, including expenditures to deploy
fourth generation Long-Term Evolution (‘‘4G LTE’’) equipment, construct cell sites, increase capacity in
existing cell sites and switches, outfit new and remodel existing retail stores, develop new billing and
other customer management related systems and platforms, and enhance existing office systems. Total
cell sites in service decreased 13% year-over-year to 6,975 primarily as a result of the NY1 &
NY2 Deconsolidation and the deactivation of certain cell sites in the Divestiture Markets.
• Operating income decreased $9.8 million, or 6%, to $146.9 million in 2013 from $156.7 million in 2012,
reflecting lower service revenues as discussed above as well as lower inbound roaming revenues,
higher equipment subsidies and accelerated depreciation related to the Divestiture Transaction. The
impacts of these items were offset by lower operating expenses in other categories and gains related
2