UPS 2004 Annual Report Download - page 57
Download and view the complete annual report
Please find page 57 of the 2004 UPS annual report below. You can navigate through the pages in the report by either clicking on the pages listed below, or by using the keyword search tool below to find specific information within the annual report.-
 1
1 -
2
-
3
-
4
-
5
-
6
-
7
-
8
-
9
-
10
-
11
-
12
-
13
-
14
-
15
-
16
-
17
-
18
-
19
-
20
-
21
-
22
-
23
-
24
-
25
-
26
-
27
-
28
-
29
-
30
-
31
-
32
-
33
-
34
-
35
-
36
-
37
-
38
-
39
-
40
-
41
-
42
-
43
-
44
-
45
-
46
-
 47
47 -
 48
48 -
 49
49 -
 50
50 -
 51
51 -
 52
52 -
 53
53 -
 54
54 -
 55
55 -
 56
56 -
 57
57 -
 58
58 -
 59
59 -
 60
60 -
 61
61 -
 62
62 -
 63
63 -
 64
64 -
 65
65 -
 66
66 -
 67
67 -
68
-
69
-
70
-
71
-
72
-
73
-
74
-
75
-
76
 |
 |

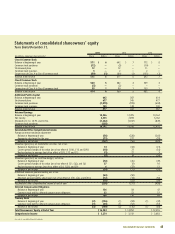
Notes to consolidated financial statements 55
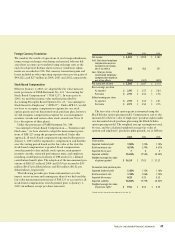
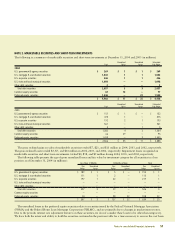
The asset allocation for our pension and other postretirement plans as of September 30, 2004 and 2003 and the target allocation
for 2005, by asset category, are as follows: Percentage of
Weighted Average Plan Assets at
Target Allocation September 30,
2005 2004 2003
Equity securities 55% - 65% 60.6% 60.2%
Fixed income securities 20% - 30% 28.0% 28.5%
Real estate/other 10% - 15% 11.4% 11.3%
Total 100.0% 100.0%
Equity securities include UPS Class A shares of common stock in the amounts of $466 (4.5% of total plan assets) and $392 million
(4.8% of total plan assets), as of September 30, 2004 and 2003, respectively.
The UPS benefit plan committees establish investment guidelines and strategies, and regularly monitor the performance of the funds
and portfolio managers. Our investment strategy with respect to pension assets is to invest the assets in accordance with ERISA and
fiduciary standards. The long-term primary objectives for our pension assets are to (1) provide for a reasonable amount of long-term
growth of capital, without undue exposure to risk; and protect the assets from erosion of purchasing power, and (2) provide invest-
ment results that meet or exceed the plans’ actuarially assumed long-term rate of return.
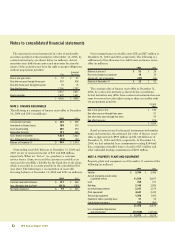
Funded Status
The funded status of the plans, reconciled to the amounts on the balance sheet, is as follows (in millions):
Postretirement
Pension Benefits Medical Benefits
2004 2003 2004 2003
Fair value of plan assets at September 30 $ 9,962 $ 7,823 $ 455 $ 409
Benefit Obligation at September 30 (9,037) (8,092) (2,694) (2,592)
Funded status at September 30 925 (269) (2,239) (2,183)
Amounts not yet recognized:
Unrecognized net actuarial loss 1,918 2,085 810 820
Unrecognized prior service cost297 331 (104) 11
Unrecognized net transition obligation 18 23 — —
Employer contributions 2752 17 17
Net asset (liability) recorded at December 31 $ 3,160 $ 2,922 $ (1,516) $ (1,335)
Prepaid pension cost $ 3,227 $ 2,970 $— $—
Accrued benefit cost (188) (153) (1,516) (1,335)
Intangible asset 45— —
Accumulated other comprehensive income (pre-tax) 117 100 — —
Net asset (liability) recorded at December 31 $ 3,160 $ 2,922 $ (1,516) $ (1,335)
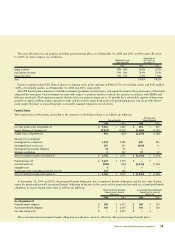
At September 30, 2004 and 2003, the projected benefit obligation, the accumulated benefit obligation, and the fair value of plan
assets for pension plans with a projected benefit obligation in excess of plan assets and for pension plans with an accumulated benefit
obligation in excess of plan assets were as follows (in millions): Projected Benefit Obligation Accumulated Benefit Obligation
Exceeds the Fair Value of Exceeds the Fair Value of
Plan Assets Plan Assets
2004 2003 2004 2003
As of September 30
Projected benefit obligation $200 $ 6,772 $200 $178
Accumulated benefit obligation $ 160 $ 6,004 $ 160 $ 154
Fair value of plan assets $— $ 6,479 $— $—
The accumulated postretirement benefit obligation exceeds plan assets for all of our other postretirement benefit plans.