UPS 2004 Annual Report Download - page 26
Download and view the complete annual report
Please find page 26 of the 2004 UPS annual report below. You can navigate through the pages in the report by either clicking on the pages listed below, or by using the keyword search tool below to find specific information within the annual report.-
 1
1 -
2
-
3
-
4
-
5
-
6
-
7
-
8
-
9
-
10
-
11
-
12
-
13
-
14
-
15
-
 16
16 -
 17
17 -
 18
18 -
 19
19 -
 20
20 -
 21
21 -
 22
22 -
 23
23 -
 24
24 -
 25
25 -
 26
26 -
 27
27 -
 28
28 -
 29
29 -
 30
30 -
 31
31 -
 32
32 -
 33
33 -
 34
34 -
 35
35 -
 36
36 -
37
-
38
-
39
-
40
-
41
-
42
-
43
-
44
-
45
-
46
-
47
-
48
-
49
-
50
-
51
-
52
-
53
-
54
-
55
-
56
-
57
-
58
-
59
-
60
-
61
-
62
-
63
-
64
-
65
-
66
-
67
-
68
-
69
-
70
-
71
-
72
-
73
-
74
-
75
-
76
 |
 |

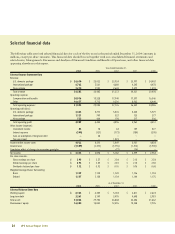
24 UPS Annual Report 2004
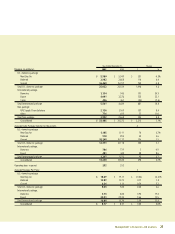
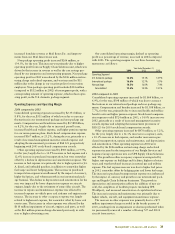
Selected financial data
The following table sets forth selected financial data for each of the five years in the period ended December 31, 2004 (amounts in
millions, except per share amounts). This financial data should be read together with our consolidated financial statements and
related notes, Management’s Discussion and Analysis of Financial Condition and Results of Operations, and other financial data
appearing elsewhere in this report.
Years Ended December 31,
2004 2003 2002 2001 2000
Selected Income Statement Data
Revenue:
U.S. domestic package $ 26,610 $ 25,022 $ 23,924 $ 23,997 $ 24,002
International package 6,762 5,561 4,680 4,245 4,078
Non-package 3,210 2,902 2,668 2,079 1,418
Total revenue 36,582 33,485 31,272 30,321 29,498
Operating expenses:
Compensation and benefits 20,916 19,328 17,940 17,397 16,546
Other 10,677 9,712 9,236 8,962 8,440
Total operating expenses 31,593 29,040 27,176 26,359 24,986
Operating profit (loss):
U.S. domestic package 3,345 3,272 3,576 3,620 3,929
International package 1,121 709 322 125 277
Non-package 523 464 198 217 306
Total operating profit 4,989 4,445 4,096 3,962 4,512
Other income (expense):
Investment income 82 18 63 159 527
Interest expense (149) (121) (173) (184) (205)
Gain on redemption of long-term debt — 28 — — —
Tax assessment — — 1,023 — —
Income before income taxes 4,922 4,370 5,009 3,937 4,834
Income taxes (1,589) (1,472) (1,755) (1,512) (1,900)
Cumulative effect of changes in accounting principles — — (72) (26) —
Net income $ 3,333 $ 2,898 $ 3,182 $ 2,399 $ 2,934
Per share amounts:
Basic earnings per share $2.95 $2.57 $ 2.84 $ 2.13 $ 2.54
Diluted earnings per share $ 2.93 $ 2.55 $ 2.81 $ 2.10 $ 2.50
Dividends declared per share $ 1.12 $ 0.92 $ 0.76 $ 0.76 $ 0.68
Weighted Average Shares Outstanding
Basic 1,129 1,128 1,120 1,126 1,153
Diluted 1,137 1,138 1,134 1,144 1,175
As of December 31,
2004 2003 2002 2001 2000
Selected Balance Sheet Data
Working capital $ 6,122 $ 4,335 $ 3,183 $ 2,811 $ 2,623
Long-term debt3,261 3,149 3,495 4,648 2,981
Total assets 33,026 29,734 26,868 24,636 21,662
Shareowners’ equity 16,384 14,852 12,455 10,248 9,735