UPS 2004 Annual Report Download - page 30
Download and view the complete annual report
Please find page 30 of the 2004 UPS annual report below. You can navigate through the pages in the report by either clicking on the pages listed below, or by using the keyword search tool below to find specific information within the annual report.-
 1
1 -
2
-
3
-
4
-
5
-
6
-
7
-
8
-
9
-
10
-
11
-
12
-
13
-
14
-
15
-
16
-
17
-
18
-
19
-
 20
20 -
 21
21 -
 22
22 -
 23
23 -
 24
24 -
 25
25 -
 26
26 -
 27
27 -
 28
28 -
 29
29 -
 30
30 -
 31
31 -
 32
32 -
 33
33 -
 34
34 -
 35
35 -
 36
36 -
 37
37 -
 38
38 -
 39
39 -
 40
40 -
41
-
42
-
43
-
44
-
45
-
46
-
47
-
48
-
49
-
50
-
51
-
52
-
53
-
54
-
55
-
56
-
57
-
58
-
59
-
60
-
61
-
62
-
63
-
64
-
65
-
66
-
67
-
68
-
69
-
70
-
71
-
72
-
73
-
74
-
75
-
76
 |
 |

28 UPS Annual Report 2004
Management’s discussion and analysis of financial condition and results of operations
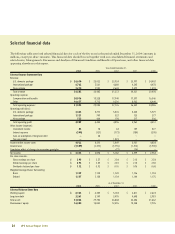
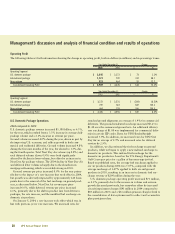
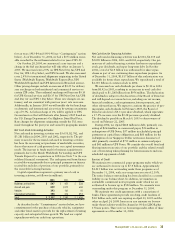
Operating Profit
The following tables set forth information showing the change in operating profit, both in dollars (in millions) and in percentage terms:
Year Ended December 31, Change
2004 2003 $ %
Operating Segment
U.S. domestic package $ 3,345 $ 3,272 $ 73 2.2%
International package 1,121 709 412 58.1
Non-package 523 464 59 12.7
Consolidated Operating Profit $ 4,989 $ 4,445 $ 544 12.2%
Year Ended December 31, Change
2003 2002 $ %
Operating Segment
U.S. domestic package $ 3,272 $ 3,576 $ (304) (8.5)%
International package 709 322 387 120.2
Non-package 464 198 266 134.3
Consolidated Operating Profit $ 4,445 $ 4,096 $ 349 8.5%
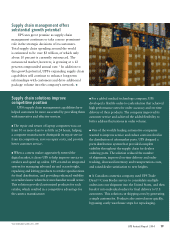
U.S. Domestic Package Operations
2004 compared to 2003
U.S. domestic package revenue increased $1.588 billion, or 6.3%,
for the year, which resulted from a 3.3% increase in average daily
package volume and a 2.1% increase in revenue per piece.
Ground volume increased 4.0% during the year, driven in part by
the improving U.S. economy, and reflects growth in both com-
mercial and residential deliveries. Ground volume increased 4.8%
during the first nine months of the year, but slowed to 1.5% dur-
ing the fourth quarter. Total Next Day Air volume (up 0.8%) and
total deferred volume (down 0.9%) were both significantly
affected by declines in letter volume, but offset by an increase in
Next Day Air package volume. The 2004 decline in Next Day Air
and deferred letter volume is largely due to the slowdown in
mortgage refinancing, which was notably strong in 2003.
Ground revenue per piece increased 0.9% for the year prima-
rily due to the impact of a rate increase that took effect in 2004,
but growth was adversely impacted by approximately 220 basis
points due to the removal of the fuel surcharge on ground prod-
ucts, as discussed below. Next Day Air revenue per piece
increased 6.6%, while deferred revenue per piece increased
6.1%, primarily due to the shift in product mix from letters to
packages, the rate increase, and the modified fuel surcharge on
domestic air products.
On January 5, 2004, a rate increase took effect which was in
line with previous years’ rate increases. We increased rates for
standard ground shipments an average of 1.9% for commercial
deliveries. The ground residential surcharge increased $0.25 to
$1.40 over the commercial ground rate. An additional delivery
area surcharge of $1.00 was implemented for commercial deliv-
eries in certain ZIP codes. Rates for UPS Hundredweight
increased 5.9%. In addition, we increased rates for UPS Next
Day Air an average of 2.9% and increased rates for deferred
services by 2.9%.
In addition, we discontinued the fuel surcharge on ground
products, while we began to apply a new indexed surcharge to
domestic air products. This indexed fuel surcharge for the
domestic air products is based on the U.S. Energy Department’s
Gulf Coast spot price for a gallon of kerosene-type jet fuel.
Based on published rates, the average fuel surcharge applied to
our air products during 2004 was 7.07%, compared with the
average surcharge of 1.47% applied to both air and ground
products in 2003, resulting in an increase in domestic fuel sur-
charge revenue of $290 million during the year.
U.S. domestic package operating profit increased $73 million,
or 2.2%, primarily due to the increase in volume and revenue
growth discussed previously, but somewhat offset by increased
aircraft impairment charges ($91 million in 2004 compared to
$69 million in 2003) and a $63 million pension charge related to
the consolidation of data systems used to collect and accumulate
plan participant data.