UPS 2004 Annual Report Download - page 47
Download and view the complete annual report
Please find page 47 of the 2004 UPS annual report below. You can navigate through the pages in the report by either clicking on the pages listed below, or by using the keyword search tool below to find specific information within the annual report.-
 1
1 -
2
-
3
-
4
-
5
-
6
-
7
-
8
-
9
-
10
-
11
-
12
-
13
-
14
-
15
-
16
-
17
-
18
-
19
-
20
-
21
-
22
-
23
-
24
-
25
-
26
-
27
-
28
-
29
-
30
-
31
-
32
-
33
-
34
-
35
-
36
-
 37
37 -
 38
38 -
 39
39 -
 40
40 -
 41
41 -
 42
42 -
 43
43 -
 44
44 -
 45
45 -
 46
46 -
 47
47 -
 48
48 -
 49
49 -
 50
50 -
 51
51 -
 52
52 -
 53
53 -
 54
54 -
 55
55 -
 56
56 -
 57
57 -
58
-
59
-
60
-
61
-
62
-
63
-
64
-
65
-
66
-
67
-
68
-
69
-
70
-
71
-
72
-
73
-
74
-
75
-
76
 |
 |

Consolidated financial statements 45
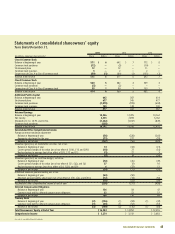
Statements of consolidated shareowners’ equity
Years Ended December 31,
2004 2003 2002
(In millions, except per share amounts) Shares Dollars Shares Dollars Shares Dollars
Class A Common Stock
Balance at beginning of year 571 $ 6 642 $ 7 772 $ 8
Common stock purchases (12) — (5) — (10) —
Stock award plans 12 — 12 — 11 —
Common stock issuances 3— 2 — 2 —
Conversions of Class A to Class B common stock (59) (1) (80) (1) (133) (1)
Balance at end of year 515 5571 6 642 7
Class B Common Stock
Balance at beginning of year 560 5482 4349 3
Common stock purchases (5) — (2) — — —
Conversions of Class A to Class B common stock 59 1 80 1 133 1
Balance at end of year 614 6560 5482 4
Additional Paid-In Capital
Balance at beginning of year 662 387 414
Stock award plans 677 545 477
Common stock purchases (1,075) (398) (604)
Common stock issuances 153 128 100
Balance at end of year 417 662 387
Retained Earnings
Balance at beginning of year 14,356 12,495 10,162
Net income 3,333 2,898 3,182
Dividends ($1.12, $0.92, and $0.76) (1,262) (1,037) (849)
Common stock purchases (235) — —
Balance at end of year 16,192 14,356 12,495
Accumulated Other Comprehensive Income
Foreign currency translation adjustment:
Balance at beginning of year (56) (328) (269)
Aggregate adjustment for the year (71) 272 (59)
Balance at end of year (127) (56) (328)
Unrealized gain (loss) on marketable securities, net of tax:
Balance at beginning of year 14 (34) (21)
Current period changes in fair value (net of tax effect of $(10), $13, and $(9)) (18) 21 (16)
Reclassification to earnings (net of tax effect of $(1), $17, and $1) (1) 27 3
Balance at end of year (5) 14 (34)
Unrealized gain (loss) on cash flow hedges, net of tax:
Balance at beginning of year (72) (26) (49)
Current period changes in fair value (net of tax effect of $21, $(6), and $6) 37 (9) 10
Reclassification to earnings (net of tax effect of $4, $(21), and $9) 6(37) 13
Balance at end of year (29) (72) (26)
Additional minimum pension liability, net of tax:
Balance at beginning of year (63) (50) —
Minimum pension liability adjustment (net of tax effect of $(5), $(6), and $(31)) (12) (13) (50)
Balance at end of year (75) (63) (50)
Accumulated other comprehensive income at end of year (236) (177) (438)
Deferred Compensation Obligations
Balance at beginning of year 136 84 47
Common stock held for deferred compensation obligations 33 52 37
Balance at end of year 169 136 84
Treasury Stock
Balance at beginning of year (2) (136) (1) (84) (1) (47)
Common stock held for deferred compensation obligations (1) (33) (1) (52) — (37)
Balance at end of year (3) (169) (2) (136) (1) (84)
Total Shareowners’ Equity at End of Year $16,384 $14,852 $ 12,455
Comprehensive Income $ 3,274 $ 3,159 $ 3,083
See notes to consolidated financial statements.