UPS 2004 Annual Report Download - page 31
Download and view the complete annual report
Please find page 31 of the 2004 UPS annual report below. You can navigate through the pages in the report by either clicking on the pages listed below, or by using the keyword search tool below to find specific information within the annual report.-
 1
1 -
2
-
3
-
4
-
5
-
6
-
7
-
8
-
9
-
10
-
11
-
12
-
13
-
14
-
15
-
16
-
17
-
18
-
19
-
20
-
 21
21 -
 22
22 -
 23
23 -
 24
24 -
 25
25 -
 26
26 -
 27
27 -
 28
28 -
 29
29 -
 30
30 -
 31
31 -
 32
32 -
 33
33 -
 34
34 -
 35
35 -
 36
36 -
 37
37 -
 38
38 -
 39
39 -
 40
40 -
 41
41 -
42
-
43
-
44
-
45
-
46
-
47
-
48
-
49
-
50
-
51
-
52
-
53
-
54
-
55
-
56
-
57
-
58
-
59
-
60
-
61
-
62
-
63
-
64
-
65
-
66
-
67
-
68
-
69
-
70
-
71
-
72
-
73
-
74
-
75
-
76
 |
 |

Management’s discussion and analysis 29
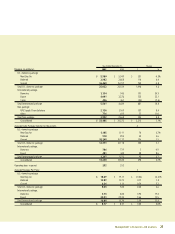
2003 compared to 2002
U.S. domestic package revenue increased $1.098 billion, or
4.6%, for the year, which was driven by a 2.1% increase in aver-
age daily package volume and a 2.6% increase in revenue per
piece. Ground volume increased by 1.5% in 2003, reversing a
2.0% decline in 2002, reflecting the improving U.S. economy
and the impact that labor negotiations had on lowering volume
during portions of 2002. The volume for our UPS Next Day Air
products increased by 6.7% during the year, driven by double-
digit growth in overnight letters which was influenced by the
strength in mortgage refinancing activity during 2003. The
increase in U.S. domestic average daily package volume was
more significant in the latter half of the year. In the third and
fourth quarters of 2003, total U.S. domestic average daily
package volume increased 3.2% and 4.9%, respectively.
The overall improvement in revenue per piece was primarily
due to the rate increase that became effective in January 2003,
with some additional benefit from the fuel surcharge as
described below. The decline in revenue per piece for the Next
Day Air products, and the relatively smaller increase for the
deferred products, was primarily due to the relatively higher
growth in letter volume compared with the growth in package
volume for these products.
On January 6, 2003, we increased rates for standard ground
shipments an average of 3.9% for commercial deliveries. The
ground residential surcharge increased $0.05 to $1.15 over the
commercial ground rate. The additional delivery area surcharge
added to residential deliveries in certain ZIP codes increased
$0.25 to $1.75. Rates for UPS Hundredweight increased 5.9%.
In addition, we increased rates for UPS Next Day Air an average
of 3.4% and increased rates for deferred services by 4.5%.
During 2003, the index-based fuel surcharge reset on a
monthly basis and was based on the National U.S. Average On-
Highway Diesel Fuel Prices as reported by the U.S. Department
of Energy. Based on published rates, the average fuel surcharge
increased to 1.47% in 2003 from 0.78% in 2002, resulting in an
increase in fuel surcharge revenue of $144 million. Effective in
2004, we discontinued the fuel surcharge on ground service,
while an indexed surcharge was applied to our Next Day Air and
deferred products. This indexed fuel surcharge for the domestic
air products was based on the U.S. Energy Department’s Gulf
Coast spot price for a gallon of kerosene-type jet fuel.
U.S. domestic package operating profit declined $304 million,
or 8.5%, primarily due to the slow volume and revenue growth
combined with an increase in operating expenses (discussed fur-
ther below under the section titled “Operating Expenses and
Operating Margin”). U.S. domestic package operating profit
increased 2.0% in the third quarter and decreased by 9.4% in
the fourth quarter. In the fourth quarter of 2002, U.S. domestic
package operating profit benefited from a $175 million credit
due to a change in our vacation policy for non-union employees.
International Package Operations
2004 compared to 2003
International package revenue improved $1.201 billion, or
21.6%, for the year primarily due to the 12.5% volume growth
for our export products and strong revenue per piece improve-
ments. Revenue increased $295 million during the year due to
currency fluctuations. Revenue growth was also impacted by the
change to our fuel surcharge (discussed below) as well as rate
changes, which vary by geographical market and occur through-
out the year. Rates for international shipments originating in the
United States (Worldwide Express, Worldwide Express Plus, UPS
Worldwide Expedited and UPS International Standard service)
increased an average of 3.5%.
In January 2004, changes were made to the calculation of our
fuel surcharge on international products (including U.S. export
products). The surcharge is now indexed to fuel prices in our dif-
ferent international regions, depending on where the shipment
takes place. The current surcharge is only applied to our interna-
tional express products, while the previous surcharge was
applied to all international products. These changes, along with
higher fuel prices, had the effect of increasing international pack-
age revenue by $231 million during the year.
We experienced double-digit export volume growth in each
region throughout the world, with the Asia-Pacific region lead-
ing with 24% export volume growth, including a 101% increase
in China export volume. Export volume continues to benefit
from our expanding international network, such as the six addi-
tional flights to Shanghai, China that were added in the fourth
quarter. European export volume grew in excess of 10%, and
was positively influenced by the addition of 10 countries to the
European Union. Non-U.S. domestic volume increased 3.7% for
the year, and primarily reflects improvements in our European
and Canadian domestic delivery businesses.
Export revenue per piece increased 9.0% for the year (3.1%
currency-adjusted), benefiting from rate increases and the impact
of the fuel surcharge. In total, international average daily pack-
age volume increased 7.0% and average revenue per piece
increased 13.6% (6.7% currency-adjusted).
The improvement in operating profit for our international
package operations was $412 million, or 58.1%, for the year,
$54 million of which was due to favorable currency fluctuations.
This increase in operating profit was primarily due to the strong
export volume growth and revenue per piece increases described
previously, and a strong increase in operating margin through
better network utilization. International operating profit was