UPS 2004 Annual Report Download - page 38
Download and view the complete annual report
Please find page 38 of the 2004 UPS annual report below. You can navigate through the pages in the report by either clicking on the pages listed below, or by using the keyword search tool below to find specific information within the annual report.-
 1
1 -
2
-
3
-
4
-
5
-
6
-
7
-
8
-
9
-
10
-
11
-
12
-
13
-
14
-
15
-
16
-
17
-
18
-
19
-
20
-
21
-
22
-
23
-
24
-
25
-
26
-
27
-
 28
28 -
 29
29 -
 30
30 -
 31
31 -
 32
32 -
 33
33 -
 34
34 -
 35
35 -
 36
36 -
 37
37 -
 38
38 -
 39
39 -
 40
40 -
 41
41 -
 42
42 -
 43
43 -
 44
44 -
 45
45 -
 46
46 -
 47
47 -
 48
48 -
49
-
50
-
51
-
52
-
53
-
54
-
55
-
56
-
57
-
58
-
59
-
60
-
61
-
62
-
63
-
64
-
65
-
66
-
67
-
68
-
69
-
70
-
71
-
72
-
73
-
74
-
75
-
76
 |
 |

36 UPS Annual Report 2004
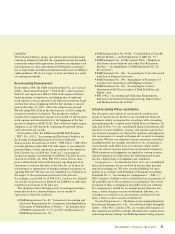
Management’s discussion and analysis of financial condition and results of operations
A discussion of our accounting policies for derivative instru-
ments and further disclosures are provided in Note 16 to the
consolidated financial statements.
Commodity Price Risk
We are exposed to an increase in the prices of refined fuels, prin-
cipally jet-A, diesel, and unleaded gasoline, which are used in the
transportation of packages. Additionally, we are exposed to an
increase in the prices of other energy products, primarily natural
gas and electricity, used in our operating facilities throughout the
world. We use a combination of options, swaps, and futures
contracts to provide some protection from rising fuel and energy
prices. These derivative instruments generally cover forecasted
fuel and energy consumption for periods of one to three years.
The net fair value of such contracts subject to price risk, exclud-
ing the underlying exposures, as of December 31, 2004 and
2003 was an asset of $101 and $30 million, respectively. The
potential loss in the fair value of these derivative contracts,
assuming a hypothetical 10% change in the underlying commod-
ity price, would be approximately $32 and $17 million at
December 31, 2004 and 2003, respectively. This amount
excludes the offsetting impact of the price risk inherent in the
physical purchase of the underlying commodities.
Foreign Currency Exchange Risk
We have foreign currency risks related to our revenue, operating
expenses, and financing transactions in currencies other than the
local currencies in which we operate. We are exposed to currency
risk from the potential changes in functional currency values of
our foreign currency-denominated assets, liabilities, and cash
flows. Our most significant foreign currency exposures relate to
the Euro, the British Pound Sterling and the Canadian Dollar. We
use a combination of purchased and written options and forward
contracts to hedge cash flow currency exposures. These derivative
instruments generally cover forecasted foreign currency exposures
for periods up to one year. As of December 31, 2004 and 2003,
the net fair value of the hedging instruments described above was
a liability of $(28) and $(48) million, respectively. The potential
loss in fair value for such instruments from a hypothetical 10%
adverse change in quoted foreign currency exchange rates would
be approximately $117 and $97 million at December 31, 2004
and 2003, respectively. This sensitivity analysis assumes a parallel
shift in the foreign currency exchange rates. Exchange rates rarely
move in the same direction. The assumption that exchange rates
change in a parallel fashion may overstate the impact of changing
exchange rates on assets and liabilities denominated in a foreign
currency.
Interest Rate Risk
As described in Note 8 to the consolidated financial statements,
we have issued debt instruments, including debt associated with
capital leases, that accrue expense at fixed and floating rates of
interest. We use a combination of derivative instruments, includ-
ing interest rate swaps and cross-currency interest rate swaps, as
part of our program to manage the fixed and floating interest
rate mix of our total debt portfolio and related overall cost of
borrowing. These swaps are generally entered into concurrently
with the issuance of the debt that they are intended to modify,
and the notional amount, interest payment, and maturity dates
of the swaps match the terms of the associated debt.
Our floating rate debt and interest rate swaps subject us to
risk resulting from changes in short-term (primarily LIBOR)
interest rates. The potential change in annual interest expense
resulting from a hypothetical 100 basis point change in short-
term interest rates applied to our floating rate debt and swap
instruments at December 31, 2004 and 2003 would be approxi-
mately $29 and $25 million, respectively.
As described in Note 1 and Note 2 to the consolidated finan-
cial statements, we have certain investments in debt, auction
rate, and preferred securities that accrue income at variable rates
of interest. The potential change in annual investment income
resulting from a hypothetical 100 basis point change in interest
rates applied to our investments exposed to variable interest
rates at December 31, 2004 and 2003 would be approximately
$45 and $31 million, respectively.
Additionally, as described in Note 3 to the consolidated finan-
cial statements, we hold a portfolio of finance receivables that
accrue income at fixed and floating rates of interest. The poten-
tial change in the annual income resulting from a hypothetical
100 basis point change in interest rates applied to our variable
rate finance receivables at December 31, 2004 and 2003 would
be immaterial.
This interest rate sensitivity analysis assumes interest rate
changes are instantaneous, parallel shifts in the yield curve. In
reality, interest rate changes are rarely instantaneous or parallel.
While this is our best estimate of the impact of the specified
interest rate scenarios, these estimates should not be viewed as
forecasts. We adjust the fixed and floating interest rate mix of
our interest rate sensitive assets and liabilities in response to
changes in market conditions.
Equity Price Risk
We hold investments in various common equity securities that
are subject to price risk, and for certain of these securities, we
utilize options to hedge this price risk. At December 31, 2004
and 2003, the fair value of such investments was $77 and $95
million, respectively. The potential change in the fair value of
such investments, assuming a 10% change in equity prices net
of the offsetting impact of any hedges, would be approximately
$8 and $10 million at December 31, 2004 and 2003.