UPS 2004 Annual Report Download - page 32
Download and view the complete annual report
Please find page 32 of the 2004 UPS annual report below. You can navigate through the pages in the report by either clicking on the pages listed below, or by using the keyword search tool below to find specific information within the annual report.-
 1
1 -
2
-
3
-
4
-
5
-
6
-
7
-
8
-
9
-
10
-
11
-
12
-
13
-
14
-
15
-
16
-
17
-
18
-
19
-
20
-
21
-
 22
22 -
 23
23 -
 24
24 -
 25
25 -
 26
26 -
 27
27 -
 28
28 -
 29
29 -
 30
30 -
 31
31 -
 32
32 -
 33
33 -
 34
34 -
 35
35 -
 36
36 -
 37
37 -
 38
38 -
 39
39 -
 40
40 -
 41
41 -
 42
42 -
43
-
44
-
45
-
46
-
47
-
48
-
49
-
50
-
51
-
52
-
53
-
54
-
55
-
56
-
57
-
58
-
59
-
60
-
61
-
62
-
63
-
64
-
65
-
66
-
67
-
68
-
69
-
70
-
71
-
72
-
73
-
74
-
75
-
76
 |
 |

30 UPS Annual Report 2004
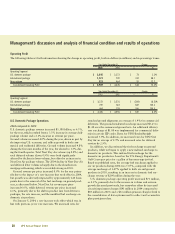
Management’s discussion and analysis of financial condition and results of operations
adversely affected by aircraft impairment charges of $19 million
in 2004, compared to a $6 million charge in 2003.
2003 compared to 2002
International package revenue improved $881 million, or 18.8%,
for the year due primarily to the 8.6% volume growth for our
export products and strong revenue per piece improvements, a
portion of which can be attributed to the impact of currency.
Revenue increased $443 million during the year due to currency
fluctuations. Export volume increased throughout the world, with
Asia-Pacific, Canada, and the Americas showing double-digit
export volume growth, and U.S. and European export volume
increasing slightly over 6%. European export volume growth was
adversely impacted by the strength of the Euro and the weak
European economy. Domestic volume increased 0.9% for the year,
reversing a 3.2% decline from the previous year, which was also
negatively affected by the weak European economy.
Export revenue per piece increased 12.5% for the year (3.3%
currency-adjusted), due to improvements in product mix and
continued focus on yield management. In total, international
average daily package volume increased 3.7% and average rev-
enue per piece increased 17.4% (6.2% currency-adjusted). The
7.6% decline in cargo revenue during the year was largely due
to a reduction of flights in our air network in the Americas.
Rates for international shipments originating in the United
States (UPS Worldwide Express, UPS Worldwide Express Plus,
UPS Worldwide Expedited and UPS Standard service) increased
an average of 3.9%. Rate changes for shipments originating out-
side the United States generally are made throughout the year
and vary by geographic market.
The improvement in operating profit for our international
package operations was $387 million for the year, $117 million
of which was due to favorable currency fluctuations. This
increase in operating profit was primarily due to the strong
export volume growth and revenue per piece increases described
previously. In 2002, international operating profit benefited
from an $11 million credit to operating expense as a result of a
change in our vacation policy for non-union employees.
Non-Package Operations
2004 compared to 2003
Non-package revenue increased $308 million, or 10.6%, for
the year. UPS Supply Chain Solutions increased revenue by
10.3% during the year, with strong growth in our air and
ground freight forwarding businesses, as well as our logistics
business. Favorable currency fluctuations provided $73 million
of the increase in revenue for the year. The remainder of our
non-package operations, which includes Mail Boxes Etc. (the
franchisor of Mail Boxes Etc. and The UPS Store), UPS Capital,
our mail and consulting services, and our excess value package
insurance business, increased revenue by 11.3% for the year,
largely due to strong double-digit franchise and royalty rev-
enue growth at Mail Boxes Etc. resulting from an expanding
store base, as well as higher excess value insurance revenue.
Menlo Worldwide Forwarding, which was acquired in
December 2004, added $33 million in revenue.
Non-package operating profit increased $59 million, or
12.7%, for the year, primarily due to improved results from our
UPS Capital, mail services, and excess value insurance business.
Mail Boxes Etc. experienced strong profit growth, due to the
increased franchise and royalty revenue noted previously. Non-
package operating profit includes $112 million (compared to
$114 million in 2003) of intersegment profit for the year, with
a corresponding amount of operating expense, which reduces
operating profit, in the U.S. domestic package segment.
During the second quarter of 2003, we sold our Mail
Technologies business unit in a transaction that increased net
income by $14 million, or $0.01 per diluted share. The gain con-
sisted of a pre-tax loss of $24 million recorded in other operating
expenses within the non-package segment, and a tax benefit of
$38 million recognized in conjunction with the sale. The tax ben-
efit exceeded the pre-tax loss from this sale primarily because the
goodwill impairment charge we previously recorded for the Mail
Technologies business unit was not deductible for income tax
purposes. Consequently, our tax basis was greater than our book
basis, thus producing the tax benefit described above.
During the third quarter of 2003, we sold our Aviation
Technologies business unit and recognized a pre-tax gain of $24
million ($15 million after-tax, or $0.01 per diluted share), which
is recorded in other operating expenses within the non-package
segment. The operating results of both the Mail Technologies
unit and the Aviation Technologies unit were previously included
in our non-package segment, and were not material to our con-
solidated operating results in any of the periods presented.
2003 compared to 2002
Non-package revenue increased $234 million, or 8.8%, for the
year. UPS Supply Chain Solutions increased revenue by 8.0%
during the year. This increase was due to growth in our supply
chain management and other logistics businesses, with interna-
tional revenues growing faster than in the United States, partially
as a result of favorable currency fluctuations. Favorable currency
fluctuations accounted for $74 million of the increase in rev-
enue. Freight forwarding revenue increased at a slower rate,
which was influenced by global economic conditions and
increased air revenue in 2002 as a result of the work disruption
at U.S. west coast ports. The remainder of our non-package
operations, which includes Mail Boxes Etc. (the franchisor of
Mail Boxes Etc. and The UPS Store), UPS Capital, our mail and
consulting services, and our excess value package insurance busi-
ness, increased revenue by 11.0% for the year, primarily due to