Thrifty Car Rental 2009 Annual Report Download - page 85
Download and view the complete annual report
Please find page 85 of the 2009 Thrifty Car Rental annual report below. You can navigate through the pages in the report by either clicking on the pages listed below, or by using the keyword search tool below to find specific information within the annual report.-
 1
1 -
2
-
3
-
4
-
5
-
6
-
7
-
8
-
9
-
10
-
11
-
12
-
13
-
14
-
15
-
16
-
17
-
18
-
19
-
20
-
21
-
22
-
23
-
24
-
25
-
26
-
27
-
28
-
29
-
30
-
31
-
32
-
33
-
34
-
35
-
36
-
37
-
38
-
39
-
40
-
41
-
42
-
43
-
44
-
45
-
46
-
47
-
48
-
49
-
50
-
51
-
52
-
53
-
54
-
55
-
56
-
57
-
58
-
59
-
60
-
61
-
62
-
63
-
64
-
65
-
66
-
67
-
68
-
69
-
70
-
71
-
72
-
73
-
74
-
 75
75 -
 76
76 -
 77
77 -
 78
78 -
 79
79 -
 80
80 -
 81
81 -
 82
82 -
 83
83 -
 84
84 -
 85
85 -
 86
86 -
 87
87 -
 88
88 -
 89
89 -
 90
90 -
 91
91 -
 92
92 -
 93
93 -
 94
94 -
 95
95 -
96
-
97
-
98
-
99
-
100
-
101
-
102
-
103
-
104
-
105
-
106
-
107
-
108
-
109
-
110
-
111
 |
 |

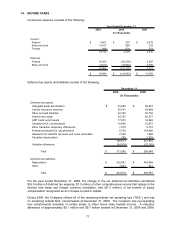
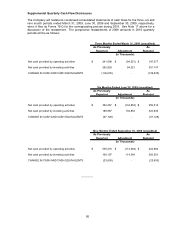
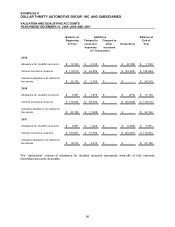
18. SELECTED QUARTERLY FINANCIAL DATA (UNAUDITED)
A summary of the quarterly operating results during 2009 and 2008 follows:
Year Ended First Second Third Fourth 2009
December 31, 2009 Quarter Quarter Quarter Quarter Total
Revenues 362,422$ 399,613$ 438,892$ 345,322$ 1,546,249$
Operating income 10,535$ 33,567$ 67,766$ 39,444$ 151,312$
Net income (loss) (8,940)$ 12,404$ 30,094$ 11,464$ 45,022$
Earnings (loss) per share: (a)
Basic (0.42)$ 0.58$ 1.38$ 0.44$ 1.98$
Diluted (0.42)$ 0.55$ 1.29$ 0.42$ 1.88$
Year Ended First Second Third Fourth 2008
December 31, 2008 Quarter Quarter Quarter Quarter Total
Revenues 396,506$ 445,730$ 500,648$ 355,109$ 1,697,993$
Operating income (loss) 4,809$ 19,918$ 62,465$ (30,633)$ 56,559$
Net income (loss) (304,238)$ (b) 10,765$ 18,933$ (72,178)$ (346,718)$ (b)
Earnings (loss) per share: (a)
Basic (14.37)$ (b) 0.50$ 0.88$ (3.36)$ (16.22)$ (b)
Diluted (14.37)$ (b) 0.49$ 0.87$ (3.36)$ (16.22)$ (b)
(a) The earnings (loss) per share is calculated from the weighted average common and common stock equivalents outstanding during
each quarter, which may fluctuate based on quarterly income levels, market prices and share repurchases. Therefore, the sum of
earnings per share information for each quarter may not equal the total year amounts.
(b) See Note 14 for restatement of 2008 income tax benefit, which occurred in the first quarter and increased
net loss by $6.3 million or $0.30 per share.
(In Thousands Except Per Share Amounts)
(In Thousands Except Per Share Amounts)
Operating income (loss) in the table above represents pre-tax income before interest, goodwill and
long-lived asset impairment and (increase) decrease in fair value of derivatives.
During the second and fourth quarters of 2009, the Company recorded favorable changes in vehicle
insurance reserve estimates of $3.8 million and $5.6 million, respectively, in conjunction with
receiving actuarial updates on its vehicle insurance programs. See Note 15 for further discussion.
In 2009, the majority relating to the fourth quarter, the Company wrote off $2.6 million (pre-tax)
related primarily to the impairment of assets at its company-owned stores and for software no longer
in use.
During the first quarter of 2008, based on a continued decline in the Company’s stock price, the
Company recorded goodwill impairment of $281.2 million (pre-tax) and reacquired franchise rights
impairment of $69.0 million (pre-tax) based on performing updated impairment analysis.
During the fourth quarter of 2008, due to continued deterioration in the operating environment, the
Company performed impairment testing related to long-lived assets and wrote off $16.6 million (pre-
tax) related to certain IT initiatives and substantially all of the long-lived assets in its Canadian
operations.
84