Thrifty Car Rental 2009 Annual Report Download - page 55
Download and view the complete annual report
Please find page 55 of the 2009 Thrifty Car Rental annual report below. You can navigate through the pages in the report by either clicking on the pages listed below, or by using the keyword search tool below to find specific information within the annual report.-
 1
1 -
2
-
3
-
4
-
5
-
6
-
7
-
8
-
9
-
10
-
11
-
12
-
13
-
14
-
15
-
16
-
17
-
18
-
19
-
20
-
21
-
22
-
23
-
24
-
25
-
26
-
27
-
28
-
29
-
30
-
31
-
32
-
33
-
34
-
35
-
36
-
37
-
38
-
39
-
40
-
41
-
42
-
43
-
44
-
 45
45 -
 46
46 -
 47
47 -
 48
48 -
 49
49 -
 50
50 -
 51
51 -
 52
52 -
 53
53 -
 54
54 -
 55
55 -
 56
56 -
 57
57 -
 58
58 -
 59
59 -
 60
60 -
 61
61 -
 62
62 -
 63
63 -
 64
64 -
 65
65 -
66
-
67
-
68
-
69
-
70
-
71
-
72
-
73
-
74
-
75
-
76
-
77
-
78
-
79
-
80
-
81
-
82
-
83
-
84
-
85
-
86
-
87
-
88
-
89
-
90
-
91
-
92
-
93
-
94
-
95
-
96
-
97
-
98
-
99
-
100
-
101
-
102
-
103
-
104
-
105
-
106
-
107
-
108
-
109
-
110
-
111
 |
 |

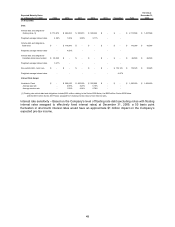
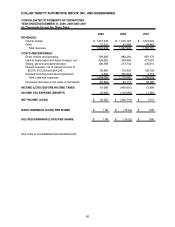
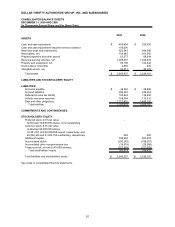
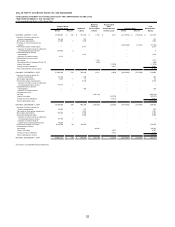
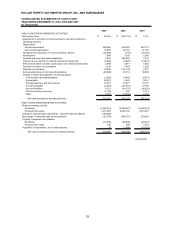
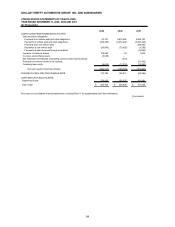
DOLLAR THRIFTY AUTOMOTIVE GROUP, INC. AND SUBSIDIARIES
CONSOLIDATED STATEMENTS OF CASH FLOWS
YEAR ENDED DECEMBER 31, 2009, 2008 AND 2007
(In Thousands)
2009 2008 2007
CASH FLOWS FROM FINANCING ACTIVITIES:
Debt and other obligations:
Proceeds from vehicle debt and other obligations 44,781 9,874,526 3,650,743
Payments of vehicle debt and other obligations (785,225) (9,972,227) (3,987,224)
Proceeds from non-vehicle debt - - 250,000
Payments of non-vehicle debt (20,000) (70,625) (1,250)
Payments of debt assumed through acquisition - - (14,092)
Issuance of common shares 129,583 33 1,669
Common stock offering costs (6,635) - -
Net settlement of employee withholding taxes on share-based awards - (373) -
Purchase of common stock for the treasury - - (71,543)
Financing issue costs (6,615) (11,512) (10,260)
Net cash used in financing activities (644,111) (180,178) (181,957)
CHANGE IN CASH AND CASH EQUIVALENTS 170,768 128,611 (90,956)
CASH AND CASH EQUIVALENTS:
Beginning of year 229,636 101,025 191,981
End of year 400,404$ 229,636$ 101,025$
See notes to consolidated financial statements, including Note 17 for supplemental cash flow information.
(Concluded)
54