Thrifty Car Rental 2009 Annual Report Download - page 38
Download and view the complete annual report
Please find page 38 of the 2009 Thrifty Car Rental annual report below. You can navigate through the pages in the report by either clicking on the pages listed below, or by using the keyword search tool below to find specific information within the annual report.-
 1
1 -
2
-
3
-
4
-
5
-
6
-
7
-
8
-
9
-
10
-
11
-
12
-
13
-
14
-
15
-
16
-
17
-
18
-
19
-
20
-
21
-
22
-
23
-
24
-
25
-
26
-
27
-
 28
28 -
 29
29 -
 30
30 -
 31
31 -
 32
32 -
 33
33 -
 34
34 -
 35
35 -
 36
36 -
 37
37 -
 38
38 -
 39
39 -
 40
40 -
 41
41 -
 42
42 -
 43
43 -
 44
44 -
 45
45 -
 46
46 -
 47
47 -
 48
48 -
49
-
50
-
51
-
52
-
53
-
54
-
55
-
56
-
57
-
58
-
59
-
60
-
61
-
62
-
63
-
64
-
65
-
66
-
67
-
68
-
69
-
70
-
71
-
72
-
73
-
74
-
75
-
76
-
77
-
78
-
79
-
80
-
81
-
82
-
83
-
84
-
85
-
86
-
87
-
88
-
89
-
90
-
91
-
92
-
93
-
94
-
95
-
96
-
97
-
98
-
99
-
100
-
101
-
102
-
103
-
104
-
105
-
106
-
107
-
108
-
109
-
110
-
111
 |
 |

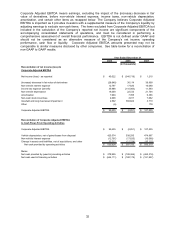
Company’s deferred compensation and retirement plans. The loss relating to the deferred compensation
and retirement plans is attributable to the mark to market valuation of the corresponding investments and
is offset in selling, general and administrative expenses and, therefore, has no impact on net income.
Additionally, there was a $2.5 million increase in parking income and a $0.6 million increase in franchise
ales income.
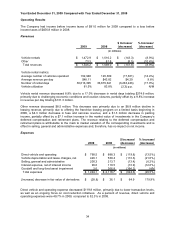
xpenses
s
E
$ Increase
/
% Increase
/
2008 2007 (decrease) (decrease)
Direct vehicle and operating 888.3$ 887.2$ 1.1$ 0.1%
Vehicle depreciation and lease charges, net 539.4 477.9 61.5 12.9%
Selling, general and administrative 213.7 230.5 (16.8) (7.3%)
Interest expense, net of interest income 110.5 109.7 0.8 0.6%
Goodwill and long-lived asset impairment 366.8 3.7 363.1 N/M
Total expenses 2,118.7$ 1,709.0$ 409.7$ 24.0%
(Increase) decrease in fair value of derivatives 36.1$ 39.0$ 2.9$ 7.4%
(in millions)
Direct vehicle and operating expense increased $1.1 million, primarily due to higher costs per transaction,
partially offset by lower transaction levels. As a percent of revenue, direct vehicle and operating
expenses were 52.3% in 2008, compared to 50.4% in 2007.
Significant fluctuations within direct vehicle and operating expense in 2008 primarily resulted from the
following:
¾Vehicle related costs increased $15.3 million. This increase resulted primarily from higher fuel
expense of $11.1 million resulting from higher average gas prices on fuel inventory consumed,
increased fuel consumption associated with the transportation of vehicles to auction, and a
significant increase in fuel expense in conjunction with the reduction of the fleet. In addition,
vehicle maintenance expense increased $5.2 million and vehicle insurance expense increased
$3.0 million. These increases were partially offset by a decrease in net vehicle damage of $7.5
million. All other fleet related expenses increased $3.5 million.
¾Bad debt expense increased $6.7 million of which $5.5 million relates to one of the Company’s
largest tour operators filing for bankruptcy during the third quarter of 2008.
¾Facility and airport concession expenses increased $1.1 million. This increase primarily resulted
from increases in rent expense of $2.6 million, partially offset by a decrease in concession fees of
$1.4 million, which are primarily based on a percentage of revenue generated from the airport
facility.
¾Personnel related expenses decreased $20.0 million. The decrease primarily resulted from a
transaction driven reduction in the number of employees, resulting in a decrease of $24.4 million,
partially offset by a $7.4 million increase in salary cost. Additionally, there was a decrease of $2.9
million in 401(k) expense due to the suspension of matching contributions that began during the
first quarter of 2008.
Net vehicle depreciation and lease charges increased $61.5 million. Net vehicle depreciation expense
and lease charges were $363 per unit in 2008, compared to $311 per unit in 2007. As a percent of
revenue, net vehicle depreciation expense and lease charges were 31.8% in 2008, compared to 27.1% in
2007.
37