Thrifty Car Rental 2009 Annual Report Download - page 35
Download and view the complete annual report
Please find page 35 of the 2009 Thrifty Car Rental annual report below. You can navigate through the pages in the report by either clicking on the pages listed below, or by using the keyword search tool below to find specific information within the annual report.-
 1
1 -
2
-
3
-
4
-
5
-
6
-
7
-
8
-
9
-
10
-
11
-
12
-
13
-
14
-
15
-
16
-
17
-
18
-
19
-
20
-
21
-
22
-
23
-
24
-
 25
25 -
 26
26 -
 27
27 -
 28
28 -
 29
29 -
 30
30 -
 31
31 -
 32
32 -
 33
33 -
 34
34 -
 35
35 -
 36
36 -
 37
37 -
 38
38 -
 39
39 -
 40
40 -
 41
41 -
 42
42 -
 43
43 -
 44
44 -
 45
45 -
46
-
47
-
48
-
49
-
50
-
51
-
52
-
53
-
54
-
55
-
56
-
57
-
58
-
59
-
60
-
61
-
62
-
63
-
64
-
65
-
66
-
67
-
68
-
69
-
70
-
71
-
72
-
73
-
74
-
75
-
76
-
77
-
78
-
79
-
80
-
81
-
82
-
83
-
84
-
85
-
86
-
87
-
88
-
89
-
90
-
91
-
92
-
93
-
94
-
95
-
96
-
97
-
98
-
99
-
100
-
101
-
102
-
103
-
104
-
105
-
106
-
107
-
108
-
109
-
110
-
111
 |
 |

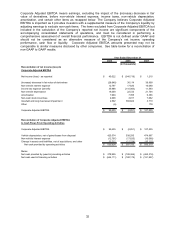
Year Ended December 31, 2009 Compared with Year Ended December 31, 2008
Operating Results
The Company had income before income taxes of $81.0 million for 2009 compared to a loss before
income taxes of $456.8 million in 2008.
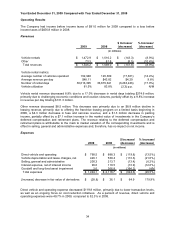
Revenues
$ Increase/ % Increase/
2009 2008 (decrease) (decrease)
Vehicle rentals 1,472.9$ 1,616.2$ (143.3)$ (8.9%)
Other 73.3 81.8 (8.5) (10.4%)
Total revenues 1,546.2$ 1,698.0$ (151.8)$ (8.9%)
Vehicle rental metrics:
Average number of vehicles operated 102,948 120,309 (17,361) (14.4%)
Average revenue per day $48.11 $43.82 $4.29 9.8%
Number of rental days 30,616,395 36,879,641 (6,263,246) (17.0%)
Vehicle utilization 81.5% 83.8% (2.3) p.p. N/M
(in millions)
Vehicle rental revenue decreased 8.9% due to a 17.0% decrease in rental days totaling $274.6 million,
primarily due to challenging economic conditions and location closures, partially offset by a 9.8% increase
in revenue per day totaling $131.3 million.
Other revenue decreased $8.5 million. This decrease was primarily due to an $8.8 million decline in
leasing revenue, primarily due to offering the franchise leasing program on a limited basis beginning in
2009, a $4.3 million decrease in fees and services revenue, and a $1.3 million decrease in parking
income, partially offset by a $7.1 million increase in the market value of investments in the Company’s
deferred compensation and retirement plans. The revenue relating to the deferred compensation and
retirement plans is attributable to the mark to market valuation of the corresponding investments and is
offset in selling, general and administrative expenses and, therefore, has no impact on net income.
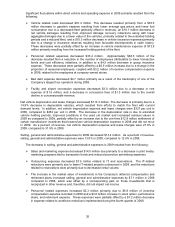
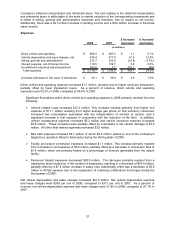
Expenses
$ Increase/ % Increase/
2009 2008 (decrease) (decrease)
Direct vehicle and operating 768.5$ 888.3$ (119.8)$ (13.5%)
Vehicle depreciation and lease charges, net 426.1 539.4 (113.3) (21.0%)
Selling, general and administrative 200.3 213.7 (13.4) (6.2%)
Interest expense, net of interest income 96.6 110.5 (13.9) (12.6%)
Goodwill and long-lived asset impairment 2.6 366.8 (364.2) N/M
Total expenses 1,494.1$ 2,118.7$ (624.6)$ (29.5%)
(Increase) decrease in fair value of derivatives (28.8)$ 36.1$ 64.9$ 179.9%
(in millions)
Direct vehicle and operating expense decreased $119.8 million, primarily due to lower transaction levels,
as well as an ongoing focus on cost reduction initiatives. As a percent of revenue, direct vehicle and
operating expenses were 49.7% in 2009, compared to 52.3% in 2008.
34